
November 30th: Real Estate Trends In The SF Bay Area
- Kevin Peterson
- Nov 30, 2023
- 5 min read

Updated: Dec 9, 2023
What four ways can I help you?
I'm the data realtor and can help analyze your specific home or market
I'm the home renovation nerd to help answer DIY or contractor questions
I knock on doors weekly to find off market properties
I constantly shop interest rates - I love helping my clients save $$$
You can help me by sharing my newsletter with a friend you think would find this information beneficial. If you know someone thinking of buying, selling, or investing, here to help.
Executive Summary
As we approach the holidays, real estate transactions historically slow down as everyone focuses on holidays and travel. With many still in shock at the high interest rate increases in October, inventory levels are near 2008 historically low levels. As a result , there is less competition for both sellers and buyers, keeping home prices stable.
Key take aways ....
FEWER SALES - Across the 5 counties, February 2023 had the lowest volume of sales at 2,716. This month we saw 3,187 sales. In November of 2022, we saw 3,747 sales. In November of 2021, we saw 6,548 sales.
30 year mortgage rates peaked in mid-October at 8.03% and are now back to 7%. Through November we saw single family homes going over sales prices by 105% while days on market hovered around 23. Condo cooled off more with the average price going at list price and days on market creeped up from the low 30s to 37.
What sold the most over asking? A Berkley single family home was listed at $1.4M. Then it sold at $2.25M seven days later, 60% over asking.
What is taking the longest to sell? San Francisco and San Mateo condos are taking the longest to sell, averaging more than 50 days on market.
What is happening to sales prices? In general, prices are above 2021 levels.
Are the holidays a good time to sell or buy?
Sellers have very little competition so expect multiple offers for well priced homes. Not sure if you want the headaches of marketing your home? Now is a great time to test the market with an "Off Market" listing. This strategy keeps your Days On Market (DOM) low while you test what buyers like. Can also give you time to fix things buyers don't like.
Buyers have less competition as many are "pausing their searches" until the better inventory comes along in the Spring.
Off Market Properties:
San Mateo (4 PLEX) Two 1 bedrooms, two studios
Santa Cruz (1622 sqft) 4 bedroom, 5 bath, 1-car garage on oversized lot
Redwood Shores (1770 sqft) 3 bedroom, 2 bath townhouse
Table of Contents:
How Are The SF Bay Area Real Estate Markets?
Overall, the San Francisco Bay Area real estate markets are maintaining sales prices. Inventory levels are low due to seller's "Golden Handcuffs", aka cheaper mortgages they purchased with or refinanced. This is resulting in potential buyers competing against limited inventory.

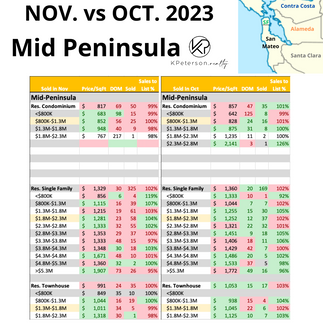
SF Bay Area Real Estate Trends - Month over Month (MoM)
The charts below are month-by-month heat maps of pricing in the SF Bay Area. They are grouped by county and property type (Condo, Single Family Home, Townhouse). The metrics are Price Per Square Foot, Days On Market, how many sold, and the List To Sales Price Ratio. Green indicates items keeping prices up in comparison to previous month's metrics. Red indicates the opposite, i.e downward pressure on sales price towards a Buyer's Market.
(Click on each county's data to make larger). Make county / location bigger than MoM.


SF Bay Area Real Estate Trends - Year over Year (YoY)
Here's the data to support the year over year price growth (supply versus demand) we are currently experiencing.
Inventory -
Every year we see active and sold inventory go up then down, a predictable cadence. How high or low is dependent on the next metric, Months of Inventory or the rate of change in inventory being sold.


Months of Inventory -
This metric tells us how long it would take to sell all the homes on the market if no new listings were added. Five to six months is considered a balanced market, anything less is a seller's market.
As active inventory goes up and the rate of sales goes down, this key performance indicator (KPI) will continue to tick upward. This metric is telling us that there are less buyers for condos right now.


% Over Asking vs. DOM -
Related to Months of Inventory and the rate of change are these next two KPIs - how much over asking a home sold for and how fast it was sold, i.e. Days On Market.
October rates peaked which resulted in less sales going over asking as well as sitting on the marker longer.


Sales Price -
If you were a buyer in February 2023 of a single family home, kudos to you!! Right now, holding stable across the 5 counties but each property and neighborhood is unique so this is a general guideline.


Please reach out to schedule your free consultation to discuss your home price or home search.
What's Selling The Most RIGHT Now?
Here are the pending details.

FED, Mortgage Rates & The Stock Market
THE CME Group predicts there is only a 4% change right now that the FED will raise rates in December.
Mortgage rates are down from their peak of 8% last month.
Stock market hit some lows in October then rallied back through most of November, helping buyers with their down payments.
When will the next Recession occur? Check out my infographics in this blog post for a brief primer. Then we can discuss the rest over our next coffee.
At KPeterson.realty, we know not every lender is created equal and we work with lenders who's rates today are around 6.15% for 10/1 ARMS. Our lenders also may value your RSUs better than others. Reach out and tap into our network.


How We Help Our Buyers
We work with the best lenders who are able to beat the current interest rates (some as low as 6.15% on a 10/1 ARM).
Search For Homes by customizing your financial situation before contacting a lender to determine what you can afford.
Investing or not sure which areas to look in? Explore Markets to generate reports that analyze a city by days on market, average home price, price per square foot, average number of bedrooms / bathrooms / square feet in YOUR price point.
How We Help Our Sellers
We have a $0 down / 0% renovation program in which you don't need to pay back for one year, giving you flexibility on when to sell. The goal is for every $1 spent on renovations to net (on average) a $2 to $4 return on investment. Every family has a unique real estate scenario based on their needs and circumstances. Feel free to schedule a consultation with me today.
Click "What's My Home Worth" to find out the rough value of your home and automatically monitor it monthly. It also shows you various options for your equity (refi, home equity line or loan, etc).
If you'd like a more specific valuation of your home, give me a call.
Check out our last few or peruse all of them at https://www.kpeterson.realty/blog
Oct 26th: Real Estate Trends In The SF Bay Area
Sep 30th: Real Estate Trends In The SF Bay Area
Aug 30th: Real Estate Trends In The SF Bay Area
Jul 19th: Real Estate Trends In The Bay Area
Jun 27th: Real Estate Trends In The Bay Area
Apr 6th: What happened To The Bay Area Real Estate In March?
Mar 16th: What Happened To Bay Area Real Estate In February?
To subscribe: https://kpeterson.realty/subscribe


Comments