
Mid-Peninsula Market Pulse — Week of October 16–22, 2026

Here's this week's San Mateo County housing market read across the ten Mid-Peninsula cities I track: Belmont, Burlingame, Foster City, Hillsborough, Menlo Park, Palo Alto, Redwood City, Redwood Shores, San Carlos, and San Mateo.

Local Market Activity (September 22 – October 22)
The Mid-Peninsula closed 297 homes in the last 30 days — 44 just this week. The typical home sold for $2.52M and went for 105.8% of asking, so sellers are still getting a premium over list. Palo Alto (44), Redwood City (41), and San Mateo (34) led single-family volume, while Hillsborough ($6.00M median) and Palo Alto ($4.38M) led on price. Palo Alto also led condos and townhomes with 14 closings.

Single-Family by Price Point
Here's how the 228 single-family sales in the last 30 days broke down by price point:
Under $2M: 47 sold at 104% of list in about 21 days.
$2–3M: 65 sold at 109% of list in about 21 days.
$3–4.5M: 68 sold at 109% of list in about 16 days — the busiest and hottest tier.
$4.5M+: 48 sold at 105% of list in about 20 days.
Over-asking isn't just an entry-level story here — it runs all the way up the price ladder.

This Week vs. the 30-Day Pace
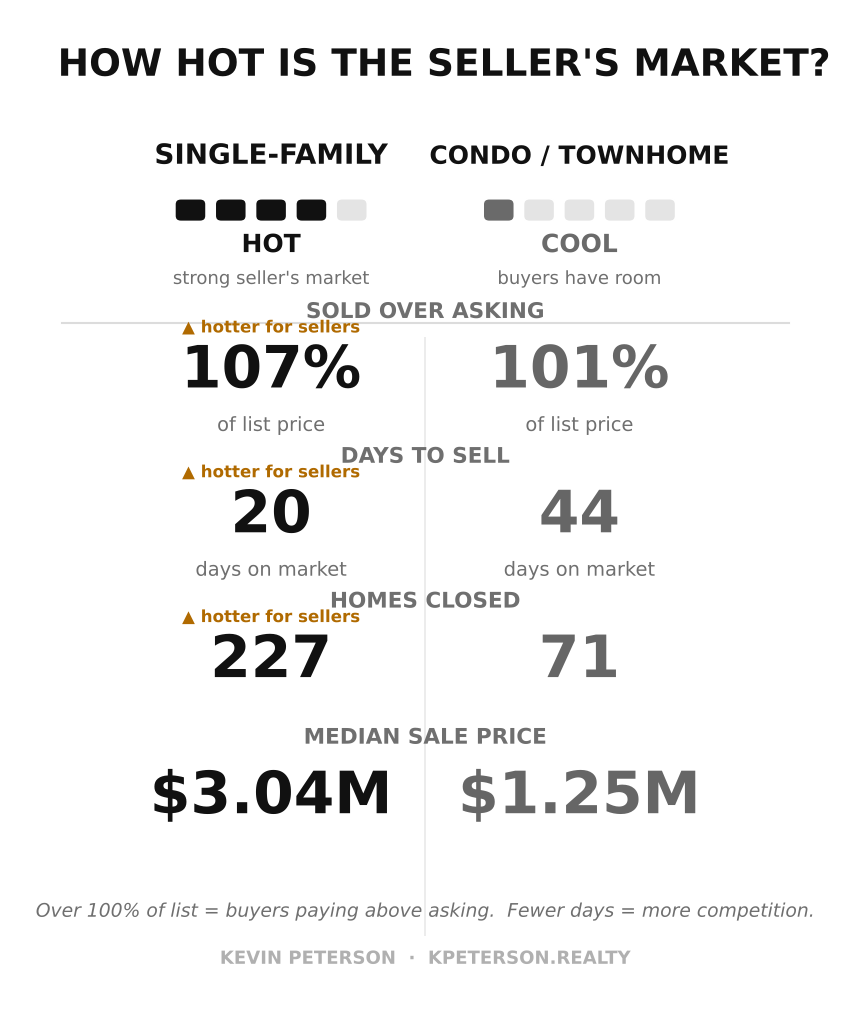
Over the last 30 days, single-family homes (228 sold) took about 19 days and sold at 107% of list, while condos and townhomes (69 sold) took longer and sold at 101% of list. This week the single-family market ran a touch hotter than the pace: 37 closings at 108% of list in about 15 days, with a median of $3.08M versus $3.03M for the full 30 days. Condos and townhomes had just 7 closings this week at about 102% of list, and a $900K median that reflects a smaller, lower-priced mix rather than a price drop. One note on the condo number: the 30-day average of about 43 days is inflated by a few long-sitting units (the longest took 203 days). The typical condo took a median of 22 days to sell, which is the better read on the market.

The Move Math
Here's what today's numbers mean for a move, using current medians and this week's 7.32% 30-year rate. (Payments are principal + interest, 20% down; taxes and insurance are on top.)
Trading up — condo to single-family:
Median condo/townhome (~$1.35M): 20% down, finance 80% — P&I ≈ $7,419/month + HOA. (Many condo buyers are investors and all cash.)
Median single-family (~$3.03M): P&I ≈ $16,678/month. (Buyers today often put 40–50% down or pay all cash due to rates and opportunity cost.)
The monthly payment gap to trade up: about $9,259 a month in principal and interest alone.
Downsizing at 55+ — don't forget Prop 19.
Prop 19 lets homeowners 55 and older carry their existing low property-tax base to their next California home (up to three times, statewide). On a long-held home, that can mean keeping a tax bill tied to a $500–700K assessed value instead of today's price — often $20,000+ a year saved.
The Macro Corner.
Mortgage rates: Freddie Mac's 30-year fixed averaged 7.32% this week (7.40% last week, 6.19% a year ago). The 15-year averaged 6.68%.
The Fed: The target range is 3.75%–4.00% after a quarter-point hike on September 16, the first since 2023. The next meeting is October 27–28; markets lean toward a hold, though most officials expect another hike by year-end.
Inflation: September headline CPI rose to 3.7% year over year (3.4% in August), driven mostly by gasoline. Core CPI was 2.6%. Core PCE, the Fed's preferred gauge, was 3.0% in August.
Wall Street: Stocks are choppy. A tech and AI-chip selloff has weighed on the Nasdaq for two weeks, with oil near its highest level since May and the 10-year Treasury yield around 5%.
Bottom line: Rates have climbed about 1.3 points since February, and the Fed is leaning toward higher, not lower. Locally, tight supply is still keeping prices firm.
Zooming out, this week's 7.32% sits below the 3-year high of 7.79% (October 2023) but well above the 3-year low of 5.98% (February 2026).

Want Your Personal Move Math?
Every move is different. Find out what your home is worth and run your own numbers: See what your home is worth →


Comments