
Mid-Peninsula Market Pulse — Week of October 23–29, 2026

Here's this week's San Mateo County housing market read across the ten Mid-Peninsula cities I track: Belmont, Burlingame, Foster City, Hillsborough, Menlo Park, Palo Alto, Redwood City, Redwood Shores, San Carlos, and San Mateo.
The short version:
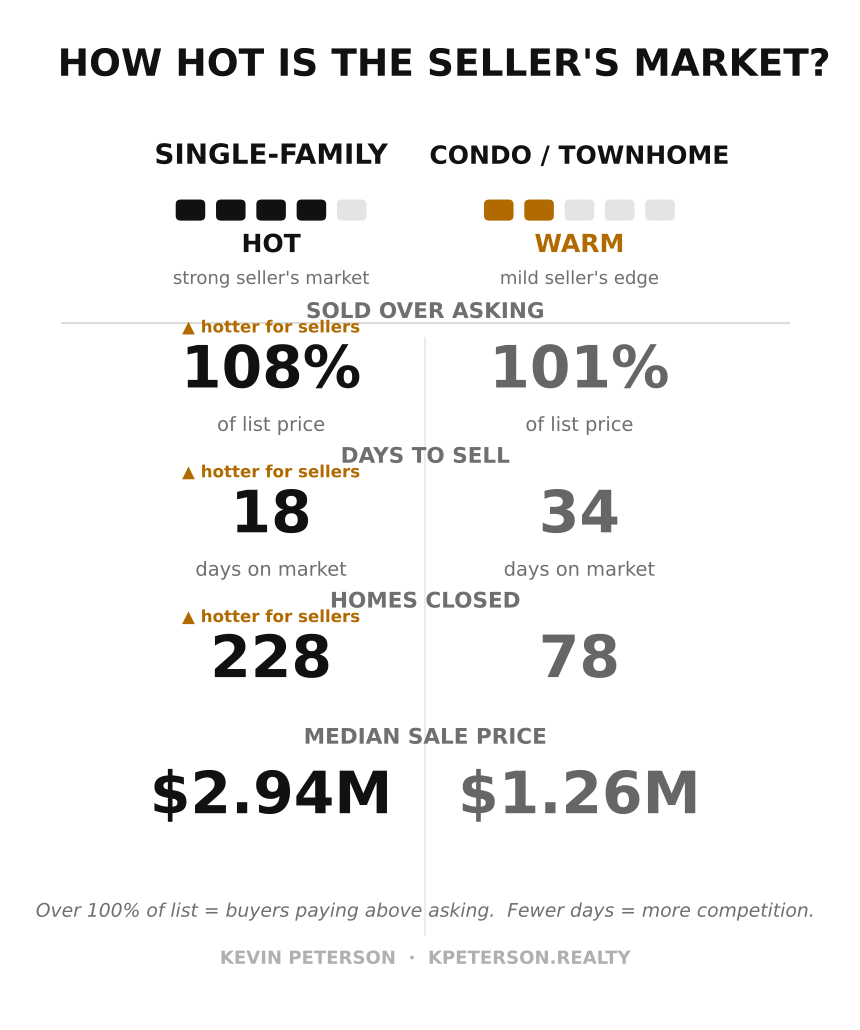
Sellers: Single-family homes across the Mid-Peninsula, from Belmont to Palo Alto, sold at 108.2% of list in about 18 days (a median of 10), and every price band closed over asking.
Buyers: Condos and townhomes are the softer segment at 100.9% of list with a median of 21 days on market. This week they closed at about 98%, a touch under asking.
Rates: The 30-year fixed averaged 7.24% (Freddie Mac, Oct 29), down from 7.32% a week earlier and up from 6.17% a year ago.
The data: 306 closed sales in ten San Mateo County and Santa Clara County Peninsula cities, September 29 – October 29, from MLS Listings.
Local Market Activity (September 29 – October 29)
The Mid-Peninsula closed 306 homes in the last 30 days — 58 just this week. The typical home sold for $2.47M and went for 106.3% of asking, so sellers are still getting a premium over list. Palo Alto (47), San Mateo (40), and Redwood City (37) led single-family volume, while Hillsborough ($6.08M median) and Palo Alto ($3.95M) led on price. San Mateo led condos and townhomes with 19 closings, followed by Palo Alto (15).

Single-Family by Price Point
Here's how the 228 single-family sales in the last 30 days broke down by price point:
Under $2M: 47 sold at 103% of list in about 22 days — the slowest and mildest tier, but still over asking.
$2–3M: 69 sold at 110% of list in about 16 days — the busiest tier.
$3–4.5M: 68 sold at 110% of list in about 14 days — the hottest tier.
$4.5M+: 44 sold at 107% of list in about 21 days.
Over-asking isn't just an entry-level story here — it runs all the way up the price ladder.

This Week vs. the 30-Day Pace
Over the last 30 days, single-family homes (228 sold) took about 18 days and sold at 108% of list, while condos and townhomes (78 sold) took longer and sold at 101% of list. This week the single-family market ran hotter than the pace: 38 closings at 110% of list in about 13 days, with a median of $2.88M versus $2.94M for the full 30 days — a slightly lower-priced mix, not a price drop. Condos and townhomes had 20 closings this week at about 98% of list (a touch under asking), with a $992,500 median that reflects a lower-priced mix. One note on the numbers: the 30-day average of about 34 days for condos is inflated by a few long-sitting units (the longest took 184 days), and single-family averages are nudged up by outliers too (the longest took 257 days). The typical home sold much faster: a median of 21 days for condos and 10 days for single-family. Those medians are the better read on the market.

The Move Math
Here's what today's numbers mean for a move, using current medians and this week's 7.24% 30-year rate. (Payments are principal + interest, 20% down; taxes and insurance are on top.)
Trading up — condo to single-family:
Median condo/townhome (~$1.26M): 20% down, finance 80% — P&I ≈ $6,864/month + HOA. (Many condo buyers are investors and all cash.)
Median single-family (~$2.94M): P&I ≈ $16,004/month. (Buyers today often put 40–50% down or pay all cash due to rates and opportunity cost.)
The monthly payment gap to trade up: about $9,100 a month in principal and interest alone.
Downsizing at 55+ — don't forget Prop 19.
Prop 19 lets homeowners 55 and older carry their existing low property-tax base to their next California home (up to three times, statewide). On a long-held home, that can mean keeping a tax bill tied to a $500–700K assessed value instead of today's price — often $20,000+ a year saved.
The Macro Corner.
Mortgage rates: Freddie Mac's 30-year fixed averaged 7.24% (7.32% the week before, 6.17% a year ago). The 15-year averaged 6.60%.
The Fed: On October 28 the Fed held the target range at 3.75%–4.00% in a 10–2 vote; both dissenters wanted a hike. That follows the September quarter-point hike, the first since 2023. The next meeting is December 8–9.
Inflation: September headline CPI was 3.7% year over year. Core CPI was 2.6%. Core PCE, the Fed's preferred gauge, was 3.0% in August.
Wall Street: In the last full week (Oct 19–23) the Dow gained 0.4% while the S&P 500 slipped 0.5% and the Nasdaq 0.7% as money rotated out of big tech into small caps, energy and health care. The 10-year Treasury yield is hovering around 5%.
Bottom line: Mortgage rates have climbed about 1.3 points since February and the Fed is leaning toward higher, not lower. Locally, tight supply is still keeping prices firm.
Zooming out, this week's 7.24% sits just below the 3-year high of 7.76% (November 2023) but well above the 3-year low of 5.98% (February 2026).

Bay Area Home Buyer and Seller FAQ
Is the San Mateo County housing market a seller's market right now?
For single-family homes, yes. In the 30 days to October 29, 228 single-family homes closed at 108.2% of list in about 18 days, and every price band sold above asking, from 103% of list under $2M to 110% between $2M and $4.5M.
What is the median home price on the Mid-Peninsula?
The combined median sale price across 306 closings was about $2.47M. Single-family homes had a median of $2.94M and condos and townhomes $1.26M. Single-family medians by city range from $2.38M in San Mateo to $6.08M in Hillsborough.
What are mortgage rates today, and what do they mean for a Bay Area move?
Freddie Mac's 30-year fixed averaged 7.24% the week of October 29. At that rate, principal and interest on 80% of the median condo is about $6,864/month and on the median single-family home about $16,004/month, a gap of roughly $9,100 a month before taxes and insurance.
Is it easier to buy a condo or townhome than a single-family home?
Condos and townhomes are less competitive. They sold at 100.9% of list with a median of 21 days, versus 108.2% and a median of 10 days for single-family. That usually gives condo buyers more room to negotiate, though every property and building is different.
How does Prop 19 help Bay Area homeowners 55 and older who want to downsize?
Prop 19 lets homeowners 55 and older carry their existing low property-tax base to their next California home, up to three times. On a long-held home, that can often save $20,000+ a year. Check with a tax professional about your situation.
Which cities does this market report cover?
Belmont, Burlingame, Foster City, Hillsborough, Menlo Park, Palo Alto, Redwood City, Redwood Shores, San Carlos, and San Mateo, using closed sales from MLS Listings. Medians are the better read for price and days on market because a few outliers can distort averages.
Want Your Personal Move Math?
Every move is different. Find out what your home is worth and run your own numbers: See what your home is worth →


Comments