
March 2025: Real Estate Trends in the SF Bay Area from San Mateo's Top Realtors
- Kevin Peterson
- Apr 19, 2025
- 13 min read

Who is KPeterson.realty and how can we help you?
The Data-Driven Realtor: With 40+ years of combined experience in global sales and management consulting, we offer advanced analytics and a unique scattergram analysis to provide unparalleled insights into your home's value and the local market. Each decision is supported by data, ensuring accuracy and confidence in your real estate journey.
Renovation Guidance: Planning renovations? We offer expert guidance on enhancements to optimize your return on investment. Our clients can also benefit from our reliable network of designers and contractors, with whom we have completed over 30 projects. Furthermore, we offer comprehensive project management for any home renovation project.
Exclusive Off-Market Opportunities: We go beyond the MLS by uncovering hidden gems. Each week, we personally connect with homeowners and leverage our network to find off-market properties tailored to your needs.
Financial Expertise: With 20+ years of experience in investing, lending, and tax strategies, we help clients navigate financing options, preserve wealth, and secure favorable terms.
KPeterson.realty Complimentary Listing Services
Luxury staging | Cleaning | Inspection: All provided at no cost to you!
Renovation & ROI Management: Maximize value with in-house contractors and project management
Financial & Tax Strategies: Expert advice on finance, diversification & wealth preservation
Pre-Market Agent Engagement: Early exposure to maximize visibility
Targeted Campaigns: Door knocking & postcards to drive significant open house traffic
Buzz-Worthy Open Houses: Captivating events, 7 days a week
Follow-Ups: Personal outreach to all visitors & agents
Digital Marketing: Paid & organic advertising to reach more buyers
Scattergram Pricing Analysis: Proprietary, data-driven strategy
Help us spread the word
If you believe our services or SF Bay Area real estate trends newsletter could be useful to someone you know, please pass along and let us know. We've got some KP swag that's cooler than a penguin in a snowstorm for you as a thank you!
Executive Summary: Five SF Bay Area Counties Proprietary Market Analysis
In the last 45 days (March and April), the San Francisco Bay Area real estate market experienced notable shifts, with increased inventory levels and evolving buyer and seller dynamics across all counties. Here's a breakdown of the key trends:
📈 Market Overview
Inventory Increase: The region saw a rise in housing inventory we've not seen in over two years, providing buyers with more options and slightly easing the competitive landscape.
Price Adjustments: While some counties experienced price stabilization, others saw modest declines, reflecting a market adjusting to changing economic conditions.
Buyer Behavior: Buyers became more discerning, leveraging increased inventory to negotiate better deals and concessions from sellers.
County-Specific Highlights
San Mateo & Santa Clara
Record-High Prices: San Mateo's median sales price reached $1.96M, while Santa Clara's hit $1.9M, driven by limited supply and sustained demand.
Overbidding Trends: Homes in these counties often sold above list price, with average sales exceeding asking prices by 3%, reflecting competitive buyer behavior.
San Francisco
Market Cooling: The city witnessed a softening in home prices, with median values decreasing from $1.3M in 2024 to $1.25M in early 2025.
Extended Time on Market: Properties averaged 45 days on the market, up from 30 days previously, indicating a slowdown in sales velocity.
Investment Opportunities: The cooling market presented opportunities for investors, particularly in neighborhoods like Outer Sunset and Bayview, where price corrections were more pronounced.
Alameda & Contra Costa
Inventory Growth: The East Bay experienced an increase in housing supply, with Alameda and Contra Costa counties seeing months of inventory rise to approximately 2.8 months, up from less than one month during the pandemic years.
Price Stabilization: Home prices in these counties showed signs of stabilizing, offering a more balanced market for buyers and sellers.
In this table, we summarize the price changes MoM (i.e. February versus March) and YoY (i.e. March 2025 versus March 2024).
County | Single-Family Homes | Condos |
San Mateo | Median Price: ~$1.96M MoM: ▲ Slight increase YoY: ▲ ~7% | Median Price: ~$905,000 MoM: ~Flat YoY: ▲ Slight uptick |
Santa Clara | Median Price: ~$1.84M MoM: ▲ ~1.7% YoY: ▲ 5.9% | Median Price: ~$845,000 MoM: ~Flat YoY: ▲ Slight increase |
San Francisco | Median Price: $1,422,500 MoM: ▼ ~Flat YoY: ▼ 9.7% | Median Price: $990,000 MoM: ▼ Slight drop YoY: ▼ 8.8% |
Alameda | Median Price: ~$1.15M MoM: ▼ 2.5% YoY: ▲ 2.3% | Median Price: ~$699,000 MoM: ▼ Slight dip YoY: ~Flat |
Contra Costa | Median Price: ~$785,000 MoM: ▼ 10.3% YoY: ▲ 2% | Median Price: ~$655,000 MoM: ▼ Slight dip YoY: ~Flat |
Key Takeaways
Sellers: Peninsula (San Mateo county) and South Bay (Santa Clara county) are still hot for single family homes (SFH). East Bay saw corrections, especially Contra Costa.
Buyers: Condos across all counties are holding or softening = better negotiating power.
Investors: Condo cap rates are improving slightly as prices ease + DOM increases. SFHs in high-demand districts still hold premium pricing.
Table of Contents:
SF Bay Area Real Estate Price Trends
KPeterson.realty Proprietary Heat Maps
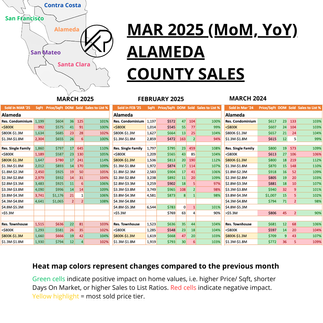
The charts below are month-over-month and year-over-year heat maps of pricing in the SF Bay Area. They are grouped by county and property type (Condo, Single Family Home, Townhouse). The metrics are Price per Square Foot, Days on Market, how many sold, and the List to Sales Price Ratio. We've now also included average square footage at each price level.
Green highlighted cells indicate items keeping prices up in comparison to previous month's metrics.
Red highlighted cells indicate the opposite, i.e downward pressure on sales price which favor buyers more.
Enlarge each county Heat Map by clicking on each of the images.


20-Year vs. 10-Year Appreciation
Bay Area single-family home prices have historically doubled every 10 years, thanks to a strong local economy and limited supply.
Right now, inventory and months of inventory are ticking up slightly due to uncertainty around tariffs and trade tensions. But once the economic picture clears up, we expect demand to bounce back and prices to rise even more quickly. Now could be a great time to buy.
Over the past decade, condos have experienced an appreciation rate of about three percent annually. This trend can be attributed to several factors, including HOA fees, which encompass insurance and maintenance inflation, as well as the challenges investors face in generating cash flow. Additionally, a post-pandemic shift has led many homeowners to seek more space, further impacting the condo market. Despite these challenges, there are still buying opportunities available for first-time homebuyers and investors.


SF Bay Area Inventory Metrics
Active Listings
The overall number of homes available on the market. An increased inventory combined with a slower selling rate typically benefits buyers, whereas decreased inventory and a faster selling rate usually benefit sellers.
Inventory Levels
Active Inventory Changes:
San Mateo: Single-family homes rose by 20%, while condos jumped 14%, indicating a shift toward a balanced market for condos.
Santa Clara: A 16% increase in single-family home inventory and 11% rise in condo inventory, both moving closer to a balanced market.
San Francisco: Both single-family homes and condos saw significant increases, with single-family home inventory rising by 22% and condos by 12%.
Alameda & Contra Costa: Moderate increases in single-family home inventory (7-8%) and larger increases in condo inventory (12%).
20-Year vs. 10-Year Inventory Levels
Every year we see active and sold inventory go up then down, a predictable cadence. How high or low is dependent on the next metric, Months of Inventory or the rate of change in inventory being sold.
In 2024, we saw historically low inventory levels (below 2,300 active single family home listings across the five counties); active inventory has now rebounded above 4,000 active listings. If this trend continues, there could be some downward pressure on sales prices due to the amount of supply being on. the market.
The graphs below show both a 20-year and 10-year time horizon for both single family homes and condos that are on the market (active) versus sold.


In March and early April, more single-family homes have been listed on the market compared to the past two years, but they are not selling as rapidly. Meanwhile, condo inventories are increasing swiftly, reaching the second highest levels since COVID in recent years.
Months of Supply
The time it would take to sell all active listings at the current sales rate.
20-Year vs. 10-Year Months of Supply
This metric tells us how hot the markets are currently, i.e. the rate of change. If no new listings were added, this metric tells us how long it would take to sell all the remaining active homes. In the last 10 years, we have been in a Seller's Market except for condos in the year of 2020, when the COVID Pandemic hit.
Buyer's Market = Over 6 months of supply
Seller's Market = Under 3 months of supply


At the end of March and the beginning of April, the inventory for single-family homes rose to 3.8 months, while condos increased to 8.4 months. This was due to a rise in listings, longer market durations, buyer hesitation, and seasonal trends as sellers ready their homes for the Spring market.
Demand Indicators
% Over Asking vs. DOM (12-Month Look Back)
How much over asking a home sold for and how fast it was sold, i.e. Days On Market are the next two Key Performance Indicators (KPIs). These show how much demand there is for SF Bay Area single family homes and condos.
Days On Market measures how long it takes for homes to sell.
Buyers: Longer DOM gives more room for negotiation.
Sellers: Shorter DOM indicates strong interest.


In March, demand for single-family homes reached its highest point in 2025, but it has been slightly declining in April due to increased inventory and economic uncertainties discussed further below.
Pending Sales
Homes under contract, i.e. Pending, show how quickly the market is moving.
The graphics below display the pending sales for all five counties, categorized by home types and price levels. The price tiers with the highest volume of pending sales for each home type and county are highlighted in yellow. For example, in San Mateo County, the most condos are sold at prices below $800K, while the most single-family homes and townhouses are sold between $800K and $1.3M. The color coding or heat map indicates changes compared to the previous month, with positive impacts on sales prices highlighted in green and negative impacts highlighted in red.

The data reveals a market in transition, with price adjustments driving activity in some counties while others maintain value. For example, in counties like Contra Costa and Alameda, we’re seeing an inverse relationship between price performance and transaction volume — a clear sign that buyers are price-sensitive. When prices rise too quickly, volume drops; when prices stabilize or dip, buyers come back in.
This underscores what we call a bifurcated market:
The well-priced, well-located, and well-presented condos are moving quickly, often with strong offers.
Meanwhile, overpriced or less desirable units are lingering, inflating inventory and pushing up Months of Inventory.
So even though total supply is increasing, the good stuff is still getting snatched up fast — it just means buyers are being pickier, and sellers can’t afford to test the market with lazy pricing.
Macroeconomics
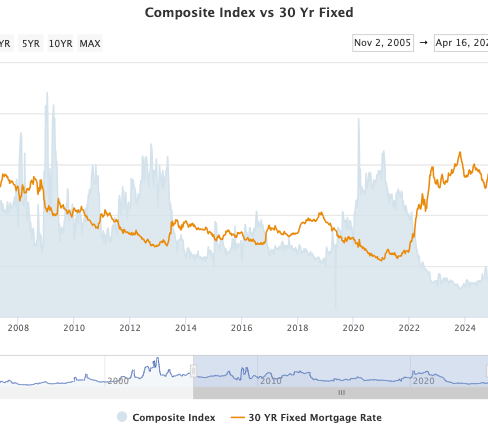
Mortgage Rates
Month-over-Month Change:
Between February and March 2025, average 30-year fixed mortgage rates in the U.S. experienced a slight decrease, dropping from approximately 6.51% to 6.45%, a reduction of about 6 basis points. This modest decline reflects ongoing market adjustments amid economic uncertainties and policy shifts. CNET
Year-over-Year Change:
Why have rates been on a rollercoaster? Because of uncertainty by investors, from sovereign nations to giant hedge funds.
If uncertainty leads to a recession or slowdown: Investors usually flee to the safety of U.S. Treasuries (think: flight to safety). That demand drives Treasury yields down, which causes mortgage rates to fall. Example: COVID-19 crash in 2020 — rates dropped like a rock.
If uncertainty is inflation-driven or tied to geopolitical risks: Markets fear the Fed might need to keep rates higher for longer. That drives yields and mortgage rates up — even if the economy’s shaky. Example: War, trade tensions, or inflation spikes — rates don’t always go down.
Mortgage rates over the last year have been like trying to read a toddler’s mood in a grocery store — just when you think things are calming down, they scream about string cheese and flip the cart.
Spring 2024, rates were high — sitting above 7% — because inflation was still throwing tantrums and the Fed hadn’t started offering any juice (rate cuts) to calm things down.
Late 2024, the Fed handed out three rate cuts like peace offerings. Everyone expected mortgage rates to chill out and nap. But nope — they stayed cranky.
By early 2025, mortgage rates started climbing again (around 6.83% in April) — not because the economy was tanking, but due to rising global trade tensions and stubborn inflation. Investors got jittery, pulled money out of U.S. Treasury bonds, and rates shot up. Instead of seeking safety in 10-year Treasuries, many shifted into foreign government bonds, gold, the Swiss franc, and even cash, signaling a broader distrust in U.S. fiscal stability. It’s a classic case of: “Bad news doesn’t always mean cheaper money.” Sometimes the market just panics and acts like a toddler who skipped lunch and spotted a stranger holding their favorite toy.


10-Year Treasury
In March 2025, the 10-year U.S. Treasury yield experienced a notable decline, dropping from approximately 4.24% at the end of February to around 4.20% by mid-March. This decrease was primarily driven by escalating recession fears, spurred by President Trump's implementation of sweeping tariffs and weakening macroeconomic data. The heightened uncertainty led investors to seek the safety of government bonds, pushing yields lower.
In April 2025, the 10-year U.S. Treasury yield has been notably volatile, fluctuating between approximately 4.14% and 4.76%. This instability is largely attributed to escalating trade tensions, particularly the imposition of tariffs by the U.S. and retaliatory measures by China, which have heightened investor concerns about inflation and potential economic slowdown.
Related, the CBOE Volatility Index (VIX) spiked to levels not seen since the early days of the COVID-19 pandemic in 2020. On April 7, the VIX soared to 60.13, marking its highest closing level since that period. This surge was primarily driven by escalating trade tensions, particularly the imposition of sweeping tariffs by the U.S., which rattled global markets and heightened investor anxiety. The elevated VIX indicates a market environment characterized by significant uncertainty and risk aversion, with investors bracing for potential volatility in the financial markets.
Stock Market (Performance in March 2025)
In March 2025, U.S. stock markets experienced significant declines, with the S&P 500 dropping 5.75% and the Nasdaq Composite falling 8.1%, marking their worst monthly performances since late 2022 . These downturns were largely attributed to escalating trade tensions, particularly President Trump's announcement of sweeping tariffs on imports from countries including China, Mexico, and Canada, which heightened fears of a global trade war . Technology stocks were among the hardest hit, with companies like Tesla and Nvidia seeing substantial losses . Amid the market volatility, investors sought refuge in safe-haven assets, driving gold prices to record highs above $3,300 an ounce .
FED (Federal Reserve)
In March 2025, the Federal Reserve held interest rates steady at 4.25% to 4.5% for the second straight meeting, signaling a cautious stance amid ongoing economic uncertainty. The Fed acknowledged solid economic growth and a strong labor market, but noted that inflation remained somewhat elevated. Policymakers projected two rate cuts later in the year, totaling 50 basis points, while keeping a close eye on external risks like trade tensions and policy shifts that could impact the outlook.
Inflation
March 2025 inflation data is mostly good, showing signs of moderation, but with some concerns about food prices and trade policies that could keep inflationary pressures volatile.
Annually, CPI rose 2.4%, down from 2.8% in February, which shows inflation is cooling. This is generally a positive trend, as lower inflation means less pressure on consumers' purchasing power.s
Employment
U.S. Employment:
The U.S. labor market demonstrated robust growth, adding 228,000 jobs—significantly surpassing economists' expectations of 135,000. This marks one of the strongest monthly gains in recent years. Fox Business
The unemployment rate edged up slightly to 4.2% from 4.1% in February, indicating a modest increase in job seekers re-entering the labor force. Reuters
Bay Area Employment:
According to Layoffs.fyi, March 2025 witnessed a significant surge in tech layoffs, with over 88,000 employees affected across various companies. This marks a notable increase compared to previous months, highlighting ongoing challenges within the tech industry.TechCrunch.com
Notable companies that announced layoffs in March include:
Block Inc.: Approximately 931 employees laid off.
HelloFresh: Around 273 positions eliminated.
Hewlett Packard Enterprise (HPE): Job cuts implemented.
TikTok: Workforce reductions reported.
Wayfair: Layoffs within the technology division.
Impact on Bay Area Real Estate:
The tech layoffs and biotech job cuts may lower housing demand in certain price points, particularly for luxury properties. However, the continued presence of major employers and robust sectors like healthcare and education may help stabilize certain markets. For buyers and renters, affordability may become a more pressing concern, with potential shifts toward more affordable housing options in suburban areas like Contra Costa and Alameda counties.
Overall, while some sectors like tech and biotech face challenges, the Bay Area real estate market will continue to be shaped by shifts in employment, housing demand, and broader economic dynamics.
Working in the SF Bay Area
Remote Work (aka Work From Home)
In March 2025, Silicon Valley companies continued to adjust their remote work policies, with many reinforcing return-to-office (RTO) mandates.
Density, a San Francisco-based company, now requires employees living within 30 miles to be in the office four days a week . This shift aims to enhance collaboration and company culture. Business Insider
Dell mandated a full return to office starting March 3, 2025. Google required employees to be in the office at least three days a week starting in April, while Apple increased in-office requirements to one day per week in April, ramping up to three days per week by May. Salesforce maintained a flexible approach, allowing employees to work remotely up to four days a week, though some roles required at least two days in the office .CEOWORLD magazine+2CBS News+2NAI NorCal+2 NAI NorCal
Despite these mandates, many employees resisted full-time office returns, leading to increased office vacancy rates in the region.
Overall, while companies are pushing for more in-person work, the transition remains complex, with many employees favoring flexible or hybrid arrangements.
Office Space
Sublease Availability Decreases: The amount of office space available for sublease decreased from 7.9 million square feet at the end of 2024 to 7.1 million square feet in the first quarter of 2025, suggesting a slight improvement in the market.
Vacancy Rates: Despite new leases, San Francisco's office vacancy rate slightly increased to 36.6% by the end of Q1 2025, influenced by ongoing remote work preferences and available sublease space. San Francisco Chronicle
Startups
Databricks Investment: AI startup Databricks announced a $1 billion investment in San Francisco over the next three years, including a new 150,000-square-foot headquarters at One Sansome. San Francisco Chronicle
The startup ecosystem presented a mixed picture. While some companies like OpenAI are on a hiring spree, focusing on data center infrastructure roles to support their AI initiatives , others faced significant layoffs. Over 2,000 tech jobs were cut in the Bay Area during the early months of 2025, with companies like Cruise, Workday, and Salesforce announcing substantial reductions . These layoffs reflect a broader trend of operational streamlining and shifts in workforce strategies within the tech sector. Business Insider
To subscribe:


Comments