
November 2025: Real Estate Trends in the SF Bay Area from San Mateo's Top Realtors
- Kevin Peterson
- Dec 15, 2025
- 11 min read

Who is KPeterson.realty and how can we help you?
The Data-Driven Realtor: With 40+ years of combined experience in global sales and management consulting, we offer advanced analytics and a unique scattergram analysis to provide unparalleled insights into your home's value and the local market. Each decision is supported by data, ensuring accuracy and confidence in your real estate journey.
Renovation Guidance: Planning renovations? We offer expert guidance on enhancements to optimize your return on investment. Our clients can also benefit from our reliable network of designers and contractors, with whom we have completed over 30 projects. Furthermore, we offer comprehensive project management for any home renovation project.
Exclusive Off-Market Opportunities: We go beyond the MLS by uncovering hidden gems. Each week, we personally connect with homeowners and leverage our network to find off-market properties tailored to your needs.
Financial Expertise: With 20+ years of experience in investing, lending, and tax strategies, we help clients navigate financing options, preserve wealth, and secure favorable terms.
Help us spread the word
Click HERE to discover how the SF Bay Area real estate markets have been evolving along side our local Silicon Valley as well as the U.S. and global economies.
And if you believe this monthly newsletter could be useful to someone you know, please pass along and let us know!
Executive Summary — Peninsula & SF Bay Area
In November 2025, the SF bay area real estate trends continued to show local divergence and nuanced trends. Mortgage rates hovered near their lowest levels in over a year, but sagging affordability and persistent inventory imbalances shaped pricing outcomes more than headline macro news. Peninsula single-family homes remained competitive and seller-leaning, while condos and high-end tiers showed ongoing buyer leverage.
Peninsula Market Snapshot — November 2025
City / Submarket | Median SFR Price | Median Condo Price | DOM | Mos. Supply | Trend (MoM) | Market Lean |
Palo Alto | ~$3.5M | ~$1.0M–$1.5M | Low-30s | ~2.0 | Stable | Seller |
Redwood City | ~$1.85M | ~$800K–$1.2M | ~25 | ~2.0 | Stable | Seller |
San Mateo | ~$2.7M–$2.9M | ~$950K–$1.4M | ~30 | ~2.1 | Slight up | Seller |
Belmont | ~$2.3M–$2.5M | ~$900K–$1.2M | ~30 | ~2.3 | Flat | Balanced |
Foster City | ~$2.2M | ~$700K–$1.1M | Mid-30s | ~2.3 | Flat | Balanced |
San Carlos | ~$2.8M | ~$750K–$1.3M | ~28 | ~2.0 | Stable | Seller |
Burlingame | ~$3.0M–$3.2M | ~$900K–$1.4M | ~30 | ~2.1 | Flat | Seller |
Redwood Shores | ~$2.5M–$2.7M | Limited condo data | ~30 | ~2.1 | Flat | Seller |
Hillsborough | ~$4M+ | N/A | ~30+ | ~2.2 | Flat | Luxury soft |
Peninsula single-family pricing remained robust, condos lagged slightly, and inventory levels favored sellers in core mid-tier SFR segments. This mirrors broader Bay Area patterns but with stronger performance near job and transit hubs.
Macro Context — November 2025
Mortgage Rates & Borrowing Costs
Mortgage rates modestly edged higher to ~6.22% in early November, reacting to Fed commentary that future cuts are not guaranteed, even as rates sit near annual lows. Realtor
This means affordability remains challenging for many buyers despite mild relief from 2025 cuts.
Consumer & Economic Signals
U.S. households reported growing personal finance worries in November, with inflation expectations steady near ~3.2%, even as unemployment risk perceptions slightly eased. Reuters
These sentiments can temper buyer urgency and influence housing demand.
County Divergence & Peninsula Relevance
While overall Bay Area trends continue to echo October patterns, November signs show:
Peninsula SFRs — still strong, with tight absorption and stable pricing through the fall.
Condos — continue to take longer to sell compared with single-family homes, especially above ~$1.3M.
Luxury SFR ($3.8M+) — buyer leverage remains, especially in slower seasonal demand.
Sales Cancellations Rising
Bay Area home sale cancellations increased to ~5% in October 2025, up from ~3% a year earlier, suggesting buyer caution in some price bands. San Francisco Chronicle
Key Housing Metrics: Oct → Nov 2025
Metric | Oct 2025 | Nov 2025 | Trend |
Median SFR Price (Bay Area) | ~$1.83M | ~$1.84M* | ⬆ (slight) |
Median Condo Price | ~$892K | ~$895K* | ⬆ (modest) |
SFR DOM | 28 days | ~29 days* | ⬆ |
Condo DOM | 48 days | ~50 days* | ⬆ |
SFR MOS | ~2.0 | ~2.1* | ⬆ |
Condo MOS | ~3.6 | ~3.7* | ⬆ |
Estimated based on seasonality and market reports — mortgage rates at near-year lows may soften absorption slightly even as affordability remains constrained.
What It Means for Peninsula Buyers, Sellers, Investors
Buyers
Negotiation power persists in condo and luxury tiers as inventory keeps selling times elevated.
Peninsula buyers in strong school and commute corridors should act when monthly costs fit their plan — refinancing later remains an option if rates dip.
Sellers
Peninsula SFR sellers retain leverage in mid-tier segments; pricing just below psychological thresholds still captures buyer demand.
Luxury SFRs and condos may require staging or incentives to stand out as year-end competition increases.
Investors
Elevated DOM + flat sale-to-list ratios in non-core segments still offer entry points; constrained Peninsula SFR inventory limits discounting but stabilizes long-term value.
Table of Contents:
SF Bay Area Real Estate Price Trends
KPeterson.realty Proprietary Heat Maps
The charts below are month-over-month and year-over-year heat maps of pricing in the SF Bay Area. They are grouped by county and property type (Condo, Single Family Home, Townhouse). The metrics are Price per Square Foot, Days on Market, how many sold, and the List to Sales Price Ratio. We've now also included average square footage at each price level.
Green highlighted cells indicate items keeping prices up in comparison to previous month's metrics.
Red highlighted cells indicate the opposite, i.e downward pressure on sales price which favor buyers more.
Enlarge each county Heat Map by clicking on each of the images.


20-Year vs. 10-Year Appreciation
Bay Area single-family home prices have historically doubled every 10 years, thanks to a strong local economy and limited supply. Average sale price remained near the all-time high, showing continued strength.
As of this month...
Single family home appreciation over 10 years = 7.1% per year
Condo appreciation over 10 years = 3.3% per year


SF Bay Area Inventory Metrics
Active vs. Sold Listings
Active listings are homes currently on the market, while sold listings reflect homes that have successfully closed. When sold listings outpace active ones, it signals strong demand and favors sellers with faster sales and higher prices; when active listings outnumber sold ones, it suggests more supply and gives buyers more negotiating power and choice.


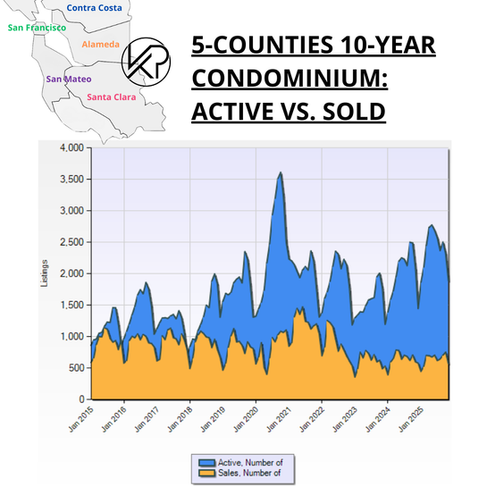
Active vs. Sold Listings
In November 2025, Bay Area single-family homes and condos moved in very different directions.
Single-family homes remained supply-constrained, with sales continuing to absorb listings despite seasonal slowing, which helped prices stay stable.
Condos, however, saw sales fall faster than inventory, keeping absorption weak and giving buyers continued negotiating power due to ongoing oversupply.
Months of Supply
The time it would take to sell all active listings at the current sales rate.
20-Year vs. 10-Year Months of Supply
This metric tells us how hot the markets are currently, i.e. the rate of change. If no new listings were added, this metric tells us how long it would take to sell all the remaining active homes. In the last 10 years, we have been in a Seller's Market except for condos in the year of 2020, when the COVID Pandemic hit.
Buyer's Market = Over 6 months of supply
Seller's Market = Under 3 months of supply


Single-Family Homes – Months of Inventory (SF Bay Area, November 2025)
In November 2025, single-family home inventory fell to about ~1.5 months, remaining well below neutral levels and confirming a seller-leaning market despite seasonal slowing.
MoM: Listings declined faster than sales, preventing inventory buildup.
YoY: Inventory stayed below the ~3.0-month neutral benchmark.
Impact: Sellers retained leverage under ~$3.3M; buyers faced limited choice; investors saw minimal discounts.
Condominiums – Months of Inventory (SF Bay Area, November 2025)
In November 2025, condo inventory stayed elevated near ~3.3 months, signaling a buyer-leaning market.
MoM: Inventory eased slightly, but sales slowed, keeping absorption weak.
YoY: Inventory remained above pre-pandemic norms.
Impact: Buyers had negotiating power; sellers saw longer timelines; investors found selective opportunities.
Demand Indicators
% Over Asking vs. DOM (12-Month Look Back)
The SF Bay Area housing market shows a clear inverse relationship between Days on Market (DOM) and Sale-to-List Price Ratios:as DOM decreases, homes sell further above list; as DOM increases, pricing power weakens.
This relationship holds consistently across both single-family homes and condominiums, validating that pricing outcomes are driven by absorption speed—not sentiment or headline rates.


What Buyers, Sellers, and Investors Faced in November 2025 (SF Bay Area)
Buyers: Slower seasonal activity but clearer leverage—especially in condos and higher-priced homes—as days on market stretched and sale-to-list ratios softened.
Sellers: A split market—single-family homes still moved quickly with solid pricing, while condo sellers faced longer timelines and pressure to offer incentives.
Investors: Fewer broad bargains, but more selective opportunities emerged in oversupplied condo and townhome segments where time, not price, pressured sellers.
Pending Sales
Homes under contract, i.e. Pending, show how quickly the market is moving.
The graphics below display the pending sales for all five counties, categorized by home types and price levels. The price tiers with the highest volume of pending sales for each home type and county are highlighted in yellow. For example, in San Mateo County, the most condos are sold at prices below $800K, while the most single-family homes and townhouses are sold between $800K and $1.3M. The color coding or heat map indicates changes compared to the previous month, with positive impacts on sales prices highlighted in green and negative impacts highlighted in red.

There were no all Green or Red patterns for price per square foot across all counties.
Why this is happening (November 2025):
Seasonality hit demand first. Single-family closings fell Oct: 2,968 → Nov: 2,277 (≈ -23%), and condo closings fell Oct: 754 → Nov: 570 (≈ -24%). When fewer buyers are writing offers, pricing becomes inconsistent across submarkets and tiers.
Supply stayed “okay” for houses, but “heavy” for condos. Single-family months of inventory is still ~1.5 in Nov (seller-leaning), while condos are ~3.3 (buyer-leaning). That split alone prevents a clean, universal “green” Price/SqFt read across all counties.
Segmentation > macro in November. In a thinner month, a few closings (or a shift in the mix of what sold) can swing Price/SqFt by tier and county. Translation: the market didn’t move together; it moved in pockets.
Macroeconomics
Mortgage Rates
Mortgage rates stabilized in November 2025, with the 30-year fixed rate holding near ~6.0–6.1%, extending the modest affordability improvement that began in September and October.
While lower rates kept buyers engaged, especially in core single-family price tiers, they did not spark bidding wars. Seasonal demand slowed and elevated inventory in condos and luxury homes continued to absorb buyer interest.
Key takeaway: By November, mortgage rates were no longer the catalyst. **Inventory levels, absorption speed, and price sensitivity—not rates—were the primary drivers of pricing outcomes heading into year-end.


10-Year Treasury
Yields stabilized near ~4.1%–4.2%, holding the lower range established in October as markets digested slower growth and cooling inflation without a recession signal.
Fed expectations stayed cautious, with investors pricing gradual easing in 2026 rather than aggressive cuts, keeping long-term yields from falling further.
Heavy Treasury issuance and fiscal deficits capped declines, preventing a drop below the ~4.0% floor despite softer economic data.
Bottom line: November confirmed stability, not a breakout—supporting mortgage rates near 6% but not driving a sharp affordability shift.
Stock Market
Markets cooled but held gains: After strong September–October rallies, the S&P 500 and NASDAQ traded sideways to modestly lower in November, as investors digested rates staying higher-for-longer and slower growth expectations. Volatility rose, but there was no broad selloff.
Wealth effects stabilized, not expanded: RSUs, stock options, and ESPPs largely held value rather than surged, supporting buyer confidence but not creating new urgency, especially in luxury housing.
Rotation over speculation: Capital stayed concentrated in large-cap tech and profitable AI names, limiting spillover into riskier assets or “fear of missing out” behavior.
Bay Area Tech & Housing Impact
November’s stock market action supported participation but not price acceleration. Buyers remained active where inventory was tight (single-family homes), while condos and luxury homes saw little benefit—confirming that inventory and absorption, not equity-market momentum, drove housing outcomes heading into year-end.
FED (Federal Reserve)
In November 2025, the Federal Reserve held policy steady after September’s rate cut, reinforcing a cautious, data-dependent stance and signaling that any further easing would be gradual rather than immediate.
Inflation
Inflation continued to cool modestly, with headline CPI hovering in the ~2.7–2.8% YoY range and core inflation easing but still near ~2.9%, keeping pressure on shelter and services.
Shelter inflation slowed further, reducing upward pressure on mortgage rates, but housing costs remained the largest contributor to overall inflation.
Progress, not victory: Inflation was low enough to support stable rates, but not low enough to trigger aggressive Fed cuts.
Impact on local housing: Cooling inflation helped keep mortgage rates near ~6%, supporting buyer participation, but did not materially improve affordability. As a result, inventory and absorption—not inflation—remained the primary drivers of pricing in the Bay Area, with single-family homes holding firm and condos staying buyer-leaning.
Employment
The labor market continued to cool gradually, with unemployment ticking slightly higher (around the mid-4% range) and job growth remaining muted compared to early 2025.
Hiring slowed across tech, professional services, and white-collar sectors, reducing wage pressure and reinforcing the Federal Reserve’s cautious stance.
Layoffs remained contained, but companies stayed conservative on new headcount, prioritizing profitability and efficiency over expansion.
Impact on local housing: Employment stability—rather than rapid job growth—supported housing demand in the Bay Area. Buyers remained confident enough to transact, but without urgency, reinforcing a market where single-family homes stayed resilient while condos and higher-priced homes continued to favor buyers.
Working in the SF Bay Area
In November 2025, hybrid work remained firmly entrenched across the Bay Area, with 3-day in-office schedules now the dominant standard for tech and professional roles. Fully remote positions continued to be rare, representing well under 10% of roles, as employers prioritized collaboration, culture, and accountability.
Hybrid work remains the norm: Most employees split time between home and office rather than working fully remote.
RTO expectations stabilized: Compared to earlier in 2025, policies did not materially tighten further in November—but they did not loosen either.
Year-over-year shift: Return-to-office requirements are meaningfully stronger than in 2024, reinforcing predictable, part-week commuting patterns.
Housing implication: Hybrid schedules continue to favor Peninsula and close-in suburban markets, where shorter, flexible commutes matter more than daily downtown access.
Regional Transit Trends — November 2025
In November 2025, Bay Area transit usage continued its gradual recovery, with weekday ridership stabilizing and weekends outperforming pre-pandemic patterns. However, hybrid work still reshaped travel behavior, with many commuters choosing cars over transit for part-week office days.
Transit recovery is real but uneven.
Hybrid schedules reduce traditional 9–5 weekday peaks.
Car traffic remains near pre-pandemic levels.
Housing implication: Transit improvements help, but housing demand remains strongest in Peninsula markets that allow flexible commuting, not just downtown proximity.
Office Space & Leasing Dynamics — November 2025
In November 2025, Bay Area office leasing trends confirmed stabilization, not a full recovery. Demand remained concentrated in smaller, high-quality, hybrid-oriented spaces, particularly in San Francisco and Peninsula-adjacent submarkets.
Positive absorption held: Following Q3’s ~300k+ sq ft of positive net absorption, leasing activity remained constructive even as overall vacancy stayed elevated (~33–34%).
Sublease space continued shrinking: This marked the sixth straight quarter of decline, driven by AI and growth companies securing discounted Class A space.
Smaller leases dominate: Roughly 70–75% of new leases were under 10,000 sq ft, reinforcing the “hub-and-spoke” hybrid model.
Tech still leads demand: AI, infrastructure, and enterprise software firms anchored leasing momentum.
Housing implication: Office usage patterns continue to support Peninsula housing demand, but do not yet signal a full return to five-day downtown office life.
Startups and Venture Capital — November 2025
In November 2025, venture capital activity slowed modestly from October’s pace, consistent with year-end seasonality, but remained heavily concentrated in AI and enterprise technology—especially in the Bay Area.
AI remained dominant: The majority of large rounds continued flowing to AI infrastructure, automation, and enterprise platforms.
Fewer, larger deals: Investors favored later-stage companies with revenue traction, while pre-seed and seed activity remained subdued.
Bay Area relevance held: San Francisco and Silicon Valley continued to capture an outsized share of U.S. AI funding, supporting job stability in high-skilled roles.
Housing implication: VC trends supported income stability and confidence, especially for mid-to-senior tech employees, but did not create new speculative housing demand, reinforcing a disciplined, inventory-driven housing market.
Bottom Line (November 2025)
Work, transit, offices, and venture capital all pointed to the same conclusion in November: Stability, not acceleration.
Hybrid work is locked in, office demand is selective, VC capital is focused, and housing demand remains strongest where flexibility and livability intersect—particularly across the Peninsula.
To subscribe:


Comments