
August 2025: Real Estate Trends in the SF Bay Area from San Mateo's Top Realtors
- Kevin Peterson
- Sep 14, 2025
- 13 min read

Who is KPeterson.realty and how can we help you?
The Data-Driven Realtor: With 40+ years of combined experience in global sales and management consulting, we offer advanced analytics and a unique scattergram analysis to provide unparalleled insights into your home's value and the local market. Each decision is supported by data, ensuring accuracy and confidence in your real estate journey.
Renovation Guidance: Planning renovations? We offer expert guidance on enhancements to optimize your return on investment. Our clients can also benefit from our reliable network of designers and contractors, with whom we have completed over 30 projects. Furthermore, we offer comprehensive project management for any home renovation project.
Exclusive Off-Market Opportunities: We go beyond the MLS by uncovering hidden gems. Each week, we personally connect with homeowners and leverage our network to find off-market properties tailored to your needs.
Financial Expertise: With 20+ years of experience in investing, lending, and tax strategies, we help clients navigate financing options, preserve wealth, and secure favorable terms.
Help us spread the word
Click HERE to discover how the SF Bay Area real estate markets have been evolving along side our local Silicon Valley as well as the U.S. and global economies.
And if you believe this monthly newsletter could be useful to someone you know, please pass along and let us know!
Executive Summary: Five SF Bay Area Counties Proprietary Market Analysis
In August 2025, home prices in the SF Bay Area held steady to slightly down compared to earlier this summer's real estate trends. Single-family homes in the $1.3M–$3.3M range are still selling over asking, while luxury homes above $3.8M and most condos (especially $1.3M+) are seeing softer prices and more negotiation space.
If you listed your home today, the average time to sell would be about 28 days for a single-family home and 49 days for a condo. In the hottest “triple-green*” price bands, sales are often happening in just 2–3 weeks.
*Triple green is for areas where days on market are short and both list-to-ask ratio and price per square foot is increasing.
Key Housing Metrics
SFR sale-to-list: ~102% (↓ from 103% in Jul) • DOM: 28 (↑ from 26).
Condo sale-to-list: ~99% (↓ from 99.5%) • DOM: 49 (↑ from 47).
Months of Supply: SFR 2.1 (seller-leaning) | Condo 4.3 (neutral → buyer).
Hottest SFR band: $1.3M–$3.3M across counties; luxury $3.8M+ cooled further. [For further breakdown, check out the Price Trends section below.]
Economic and Labor Highlights
Mortgage rates: ~6.29% (Aug), lowest since spring; applications still cautious.
10-yr Treasury: ~4.32% (Aug), stuck in a 4.3–4.4% range.
Inflation: Headline ~2.8% YoY; core ~3.0%—cooling, but above target.
Jobs: Only 22k added in Aug; unemployment 4.3%; wage growth slowing.
Commercial, Transit, and Work Trends
SF office: Leasing surged (AI-led) but vacancy remains ~23–28%.
Hybrid/RTO: Drifting toward ~3 in-office days; BART ridership below 2019; agencies pushing BayPass and service tweaks.
Startups & VC: AI dominates 2025 funding; mega-rounds and new funds support office demand and high-income hiring.
What This Means for Buyers, Sellers, and Investors
For Buyers:
Target condos (esp. $1.3M+) and luxury SFRs—buyer leverage is growing (longer DOM, flatter pricing).
In $1.3M–$3.3M SFR zones, act fast and be offer-ready; overbids shrank, but clean terms still win.
For Sellers:
List into triple-green SFR bands; price just below psychological thresholds (e.g., $2.99M).
Condos/luxury: win on pricing, presentation, and incentives (credits, rate buydowns).
For Investors:
Focus on triple-green SFR tiers with depth of demand:
Alameda County SFR $1.3M–$1.8M
Contra Costa County SFR $1.8M–$2.3M
San Mateo County SFR $2.8M–$3.3M
These segments pair rising prices + faster DOM + strong pendings, ideal for flips/short holds.
Buy-and-hold: entry-level condos < $800K in Alameda/Contra Costa for yield and renter demand.
Table of Contents:
SF Bay Area Real Estate Price Trends
KPeterson.realty Proprietary Heat Maps
The charts below are month-over-month and year-over-year heat maps of pricing in the SF Bay Area. They are grouped by county and property type (Condo, Single Family Home, Townhouse). The metrics are Price per Square Foot, Days on Market, how many sold, and the List to Sales Price Ratio. We've now also included average square footage at each price level.
Green highlighted cells indicate items keeping prices up in comparison to previous month's metrics.
Red highlighted cells indicate the opposite, i.e downward pressure on sales price which favor buyers more.
Enlarge each county Heat Map by clicking on each of the images.


SF Bay Area Real Estate Market Matrix - July 2025
County | Property Type | Market Type | Best Price Points for Sellers | Best Price Points for Buyers |
San Mateo | Condos | 🛑 Buyer-Leaning | None — most tiers at/below list, DOM 56+ | <$800K (long DOM, prices softening) |
SFR | ✅ Seller | $1.3M–$3.3M (103–105% list-to-sale, DOM 22–29) | <$800K (DOM ~35+, weaker demand) | |
Townhomes | ⚖️ Neutral | $800K–$1.3M (100% list-to-sale, DOM ~28) | Higher tiers (DOM longer, flat pricing) | |
Santa Clara | Condos | ⚖️ Neutral | <$800K (99–100% list-to-sale, DOM mid-40s) | $1.3M+ (DOM 43–49, prices softening) |
SFR | ✅ Strong Seller | $1.3M–$2.8M (102–105% list-to-sale, DOM ~23–26) | <$800K (DOM 35+, PPSF not growing) | |
Townhomes | ✅ Seller | $1.3M–$1.8M (105% list-to-sale, DOM 27–30) | <$800K (DOM 40+, prices down) | |
Alameda | Condos | ⚖️ Neutral | <$800K (99% list-to-sale, DOM ~52) | $800K–$1.3M (DOM 40+, flat YoY) |
SFR | ✅ Seller | $1.3M–$2.3M (102–105% list-to-sale, DOM 23–29) | <$800K (DOM 35+, PPSF lagging) | |
Townhomes | ⚖️ Neutral | $800K–$1.3M (100–102% list-to-sale, DOM ~37) | <$800K (DOM 37+, slower absorption) | |
Contra Costa | Condos | ⚖️ Neutral | <$800K (99–100% list-to-sale, DOM 30–35) | $1.3M+ (DOM rises, thin sales) |
SFR | ⚖️ Neutral | $800K–$1.3M (101–103% list-to-sale, DOM ~27–32) | $2.3M+ (DOM 30–40, 95–98% list-to-sale) | |
Townhomes | 🛑 Buyer | N/A | All price points (DOM elevated, 99–100% list-to-sale) | |
San Francisco | Condos | 🛑 Buyer | N/A | All tiers (DOM 69, ~100% list-to-sale, flat PPSF) |
SFR | ✅ Strong Seller | All tie |
20-Year vs. 10-Year Appreciation
Bay Area single-family home prices have historically doubled every 10 years, thanks to a strong local economy and limited supply. Average sale price remained near the all-time high, showing continued strength.
As of this month...
Single family home appreciation over 10 years = 7.1% per year
Condo appreciation over 10 years = 3.3% per year


SF Bay Area Inventory Metrics
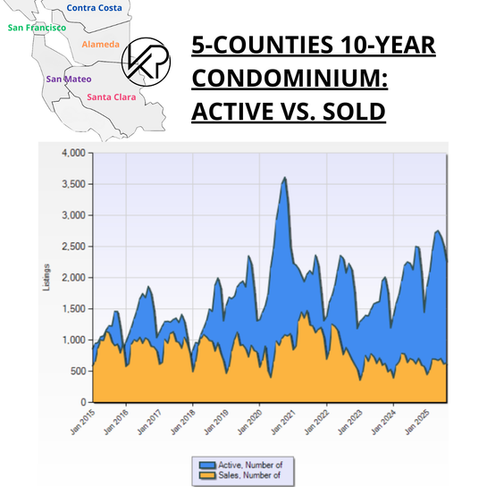
Active vs. Sold Listings
Active listings are homes currently on the market, while sold listings reflect homes that have successfully closed. When sold listings outpace active ones, it signals strong demand and favors sellers with faster sales and higher prices; when active listings outnumber sold ones, it suggests more supply and gives buyers more negotiating power and choice.


Single-Family Homes – August 2025
Month-over-Month (MoM):
Active listings edged down slightly from July, a normal late-summer dip.
$1.3M–$3.3M segment remains strongest (selling 102–105% of list, DOM ~22–29).
Luxury tiers ($3.8M+) softened further → longer DOM (30–40+) and many trading at/under list.
Year-over-Year (YoY):
Inventory higher than Aug ’24, but sold volume also steady, keeping competition healthy.
Family-focused submarkets (good schools, 3–4BR SFRs) still see over-asking, often first to sell.
Overbidding eased vs 2024 → avg. SFR sale-to-list now ~102–105% vs 105–109% last year.
Compared to Historic Norms:
Inventory still well below 2008–2012 and pre-pandemic averages.
Market remains seller-leaning, but luxury SFRs are cooling faster than mid-range family homes.
Condominiums – August 2025
Month-over-Month (MoM):
Condo listings climbed again, while sales stayed flat → supply-demand gap widening.
Weakest segment is $1.3M+ luxury condos → DOM often 45–60+, many selling at or below list.
Some mid-tier (<$800K) condos still moving, but at modest discounts.
Year-over-Year (YoY):
Inventory sharply up vs Aug ’24, especially in SF, San Mateo, Santa Clara.
Pending & closed sales lower YoY, concentrated in higher-density, urban cores.
Buyers more cautious, except cash buyers or those securing below-market deals.
Compared to Historic Norms:
Inventory now resembling early 2020 levels, far above post-pandemic lows.
Firmly buyer-friendly environment, with room to negotiate on both price and terms.
Final Takeaway:
Segment | August 2025 Status | Trend vs July | Long-Term Comparison |
Single-Family Homes | Inventory dipped seasonally; $1.3M–$3.3M hot, luxury slow | ⚠️ Luxury tiers cooling | ✅ Still seller-leaning, tighter than 2008–12 |
Condominiums | Listings ↑ again, sales flat/declining; weakest $1.3M+ condos | 📉 Buyer leverage growing | ⚠️ Resembles early 2020 oversupply |
Months of Supply
The time it would take to sell all active listings at the current sales rate.
20-Year vs. 10-Year Months of Supply
This metric tells us how hot the markets are currently, i.e. the rate of change. If no new listings were added, this metric tells us how long it would take to sell all the remaining active homes. In the last 10 years, we have been in a Seller's Market except for condos in the year of 2020, when the COVID Pandemic hit.
Buyer's Market = Over 6 months of supply
Seller's Market = Under 3 months of supply


🏡 Single-Family Homes – August 2025
August: 2.1 months of inventory ➡️ still a seller’s market, inching closer to neutral.
MoM: 2.3 → 2.1 📉 slight tightening as summer inventory dipped.
YoY: Higher than Aug ’24, but still well below 2022–23 peaks → demand steady, especially $1.3M–$3.3M.
🏢 Condominiums – August 2025
August: 4.3 months of inventory ➡️ neutral, shifting toward buyer-friendly in many urban cores.
MoM: 4.1 → 4.3 📈 listings outpacing sales again.
YoY: Highest since early 2020, with $1.3M+ and downtown condos under the most pressure.
Quick summary
Segment | Buyer Advantage | Seller Advantage | Advice |
SFR | ❌ Low | ✅ High | Buyers: move quickly in $1.3M–$3.3M zones 🎯; Sellers: still strong position, list before fall slowdown. |
Condos | ✅ Moderate | ⚠️ Weak | Buyers: negotiate firmly 💸, esp. in high-end/urban tiers; Sellers: sharpen pricing, improve presentation, consider concessions. |
Demand Indicators
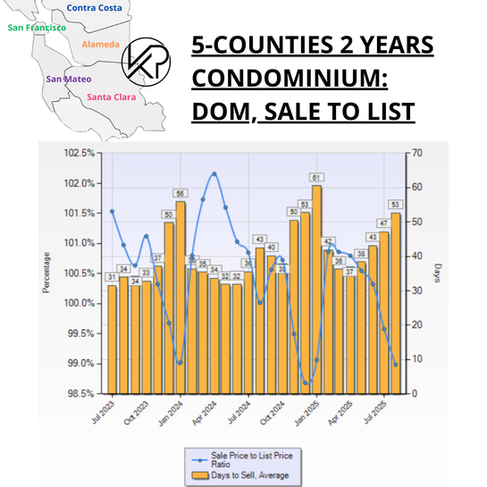
% Over Asking vs. DOM (12-Month Look Back)
How much over asking a home sold for and how fast it was sold, i.e. Days On Market are the next two Key Performance Indicators (KPIs) for our SF bay area real estate trends. These show how much demand there is for SF Bay Area single family homes and condos.
Days On Market measures how long it takes for homes to sell.
Buyers: Longer DOM gives more room for negotiation.
Sellers: Shorter DOM indicates strong interest.


🏡 Single-Family Homes – August 2025
Sale-to-list ratio: ~102% 📉 (down from 103% in July) → overbids shrinking.
DOM: 28 days 📈 (up from 26 in July) → homes taking longer to move.
Takeaway: Still seller-leaning, especially $1.3M–$3.3M family homes, but momentum cooling at luxury tiers.
🏢 Condominiums – August 2025
Sale-to-list ratio: ~99% 📉 (down from 99.5% in July) → buyers negotiating more.
DOM: 49 days 📈 (up from 47 in July) → demand soft, supply heavy.
Takeaway: Firmly buyer’s market, especially $1.3M+ and urban condos. Sellers need sharp pricing + incentives to stand out.
Pending Sales
Homes under contract, i.e. Pending, show how quickly the market is moving.
The graphics below display the pending sales for all five counties, categorized by home types and price levels. The price tiers with the highest volume of pending sales for each home type and county are highlighted in yellow. For example, in San Mateo County, the most condos are sold at prices below $800K, while the most single-family homes and townhouses are sold between $800K and $1.3M. The color coding or heat map indicates changes compared to the previous month, with positive impacts on sales prices highlighted in green and negative impacts highlighted in red.

✅ Green (Seller-Favorable) Patterns – August 2025
(All three metrics aligned: Price/SqFt ↑, DOM ↓, Pending ↑)
San Mateo — SFR $1.3M–$2.3M (103–105% list-to-sale, DOM ~22–27)
Alameda — SFR $1.3M–$2.3M (102–105% list-to-sale, DOM mid-20s)
Santa Clara — SFR $1.3M–$2.8M (strong over-asking, DOM ~23–26)
San Francisco — SFR all mid-tier ($1.3M–$2.3M) (🔥 113% list-to-sale, DOM ~32)
Contra Costa — Entry SFRs <$800K–$1.3M (101–103% list-to-sale, DOM ~27–31)
🟥 Red (Buyer-Leverage) Zones – August 2025
(All three metrics aligned: Price/SqFt ↓, DOM ↑, Pending ↓)
San Mateo — Condos $1.3M+ (PPSF down, DOM ~56+, list-to-sale <100%)
Alameda — Condos $800K+ (DOM 40–55, sale-to-list flat/weak)
Santa Clara — Condos $1.3M+ (DOM 45–60, soft pricing, 99% list)
San Francisco — Condos all tiers (DOM ~69, PPSF flat/down, sale-to-list ~100%)
Contra Costa — SFR $2.3M+ (DOM ~30–40, 95–98% list)
👉 Shift from July:
More Green zones shifted into core family SFR price bands ($1.3M–$2.8M across counties).
Red zones expanded in condos, especially high-end and urban.
Luxury SFRs ($3.8M+) mostly lost momentum → no longer green, many sliding into neutral or red.
Macroeconomics
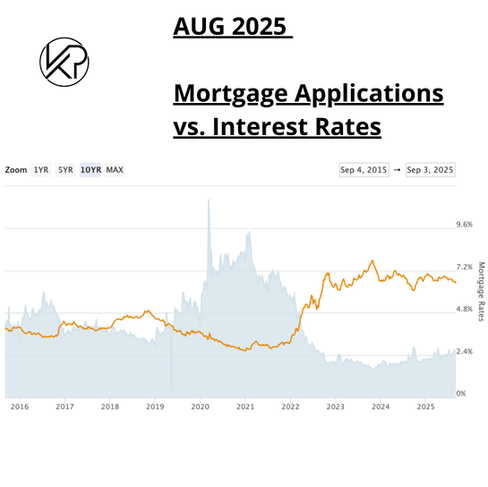
Mortgage Rates
30-year fixed rates slipped another 28 bps in August to ~6.29%.
Still well above pre-2022 norms, keeping affordability constrained.
Mortgage applications remained muted, showing buyers cautious despite lower rates.
If rates drift lower into fall, expect a pickup in demand, especially in the competitive $1.3M–$3.3M single-family segment.


10-Year Treasury
August average: ~4.32% (a small drop from 4.39% in July).
The yield has stayed stuck around 4.3%–4.4% all year, showing investors think the Fed won’t change rates anytime soon.
What’s keeping it high? Stubborn inflation, the government borrowing more money, and lots of new bonds being sold.
Looking ahead: if the Fed cuts rates later in 2025, the yield could slip — and that would likely keep mortgage rates from rising.
Stock Market
NASDAQ (Tech-Heavy Index)
August 2025: +2.1% — continued to notch new record highs, though pace slowed from July.
July 2025: +3.7% — 14 record closes in a single month.
YoY (Aug ’24 → Aug ’25): +26% — still the leader, powered by AI, chips, and cloud growth.
S&P 500
August 2025: +1.6% — steady gains, hitting new records early in the month.
July 2025: +2.9% — strong rally with five straight record closes mid-month.
YoY: +18% — broad strength, led by tech and healthcare.
Dow Jones Industrial Average
August 2025: +0.5% — lagged again; energy and industrials were weak spots.
July 2025: +0.9% — modest gains, trailing NASDAQ & S&P.
YoY: +7% — positive, but far behind tech-heavy NASDAQ.
Bay Area Tech Impact
Local giants Microsoft, Meta, and Nvidia again beat earnings expectations in August, sustaining investor optimism.
Stock-option wealth is rising — boosting liquidity for many Bay Area tech employees.
Expect this to support high-end home demand into Q4, especially for buyers leveraging equity gains.
FED (Federal Reserve)
Fed Rate Held Steady: The Federal Reserve maintained its benchmark interest rate at 4.25%–4.50% during the August meeting, marking the sixth consecutive pause in a row.
Growing Momentum for a September Cut: Following weak job numbers—just 22,000 new jobs added in August, falling far short of expectations—markets are now pricing in a 90–100% chance of a 25 basis-point cut at the Fed’s September 17–18 meeting, with some even considering a potential half-point cut.
What This Means for Borrowers: As long as the Fed holds tight now, mortgage rates are likely to stay elevated through late summer. But if a cut materializes in early fall, mortgage rates could begin to edge lower, offering some relief for homebuyers.
What Could Push the Fed to Cut Rates?
📉 Inflation: If CPI/PCE keep dropping toward 2%.
👷 Jobs: Weak hiring & rising unemployment = more pressure to cut.
💵 Spending: Slower retail sales & confidence show households struggling.
📊 Growth: Softer GDP = Fed shifts to support economy.
🏦 Markets: Credit stress or stock pullbacks could force action.
Buyers: Falling inflation + weak jobs = cheaper mortgages.
Sellers: Cuts can boost demand, but recession fears may mute enthusiasm.
Inflation
Headline CPI (Aug YoY): 2.84%, a slight decrease from earlier in the year — indicating inflation is gradually cooling.
Core CPI (excludes food & energy): 3.05% YoY, still elevated and signaling ongoing price pressures in everyday goods and services.
Month-over-month (Aug): Headline CPI rose by 0.30%, while Core CPI increased approximately 0.25%.
Key driver: Shelter costs remain high, although slightly eased from earlier months — still making up the largest share of inflation.
Takeaway: Inflation is coming down slowly. While total inflation is settling, the sustained strength in core inflation suggests the Fed may proceed cautiously — keeping pressure on mortgage rates for now.
What to Watch For
Inflation is still above the Fed’s 2% target → keeping borrowing costs and mortgage rates higher than buyers would like.
Mild recession with falling inflation? Mortgage rates likely drop.
Stagflation or persistent inflation? Rates could stay elevated even as the economy struggles.
Shelter costs remain the biggest driver, but if they cool further, it could help pull inflation (and eventually rates) lower.
Trade & tariff pressures may cause short-term price bumps, creating temporary setbacks in the inflation fight.
Bottom line: Expect rates to stay elevated near-term, with potential relief later in 2025 if inflation eases and the Fed begins cutting.
Employment
The U.S. added just 22,000 jobs in August, far below the expected ~75,000, and a sharp decline from earlier in the year.
The unemployment rate rose to 4.3%, the highest in nearly four years.
Labor market growth has significantly slowed—firms are hiring much less, even as job openings decline.
Some sectors, notably manufacturing, construction, and professional services, are retrenching; gains are primarily in healthcare and leisure/hospitality.
In the Bay Area, tech layoffs continue, though at a slower pace. Healthcare, clean tech, and biotech hiring in Silicon Valley somewhat offset these job losses.
What to Watch For
Future payroll reports: Continued softness could push the Fed toward rate cuts, further lowering mortgage rates.
Unemployment claims rising steadily would reinforce signs of a weakening job market.
San Francisco Bay Area sector strength—growth in AI, healthcare, biotech, and clean energy hiring may help sustain homebuyer demand even amid broader market cooling.
Working in the SF Bay Area
Remote Work & RTO Mandates
Microsoft is still reviewing stricter return-to-office rules—possibly 3 days per week starting January 2026, with a final decision expected soon.
Across industries, more companies like Amazon, JPMorgan, TikTok, Ford, and Goldman Sachs are requiring employees to work in-office most days, signaling a broader shift away from pandemic-era flexibility.
Regional Transit Trends
Office attendance is transitioning: while weekday ridership on BART has grown slightly, overall usage remains below pre-pandemic levels due to continued remote and hybrid work.
With lower ridership, transit agencies are introducing new fare programs (e.g., BayPass) and service improvements to attract riders.
Office Space & leasing dynamics
San Francisco’s office market is rebounding—leasing activity has surged past pre-COVID levels, especially fueled by AI firms. Business Insider
Despite this growth, vacancy remains high at 22.8%–27.7%. Reuters
Leasing momentum continues: Q2 2025 saw strong absorption (~2.85 msf), reduced availability, and growing investor confidence.
Startups and Venture Capital
68% of all U.S. startup funding in the first half of 2025 flowed into companies headquartered in California. Crunchbase
Mega VC Funds Make a Response to the Downturn - Venture markets rebounded strongly in August: globally, VC funding surged with mega-rounds, rising IPO activity, and institutional players piling back into the game. Andreessen Horowitz launched a gargantuan $20 billion AI-focused fund, signaling their belief that the AI boom is far from over. Meanwhile, SoftBank’s Vision Fund III ($40B) and sovereign wealth funds from the Gulf made aggressive plays across tech sectors. sectors.sergeytereshkin
Record-Breaking AI Funding for OpenAI - OpenAI secured a mind-boggling $8.3 billion in a late-stage funding round at a $300 billion valuation—a glaring statement that investors are placing big bets on generative AI’s future. Tech Startups
AI Dominates Venture Capital - In the first half of 2025, AI startups accounted for 58% of all VC dollars deployed, while making up just 36% of the total deal count—highlighting the disproportionate capital concentration in AI. Silicon Valley Bank
Healthtech Rebounds on AI Tailwinds - U.S. and European healthtech startups raised $7.9 billion in VC funding in H1 2025—staying on track for its strongest year since 2022. AI-powered services are seen as prime drivers for personalized efficiency and cost-saving innovation. Wall Street Journal
Why It Matters for Real Estate
VC = Housing Demand: Mega-funding (OpenAI $8.3B, a16z $20B AI fund) brings high-paid talent into the Bay Area, boosting competition for homes.
AI & Healthtech Hiring Surge: These sectors cluster around Stanford, UCSF, and South Bay hubs, drawing families into Peninsula suburbs with good schools.
IPO Cash Buyers: Reviving IPO activity creates equity-rich buyers ready to diversify into real estate.
Confidence Ripple: Big funding rounds spark optimism, making buyers more comfortable stretching for mortgages—even at higher rates.
Early Indicator: Tracking VC trends lets you forecast real estate demand before it shows up in MLS data.
To subscribe:


Comments