
Mid-Peninsula Market Pulse — Week of October 30 – November 5, 2026

Here's this week's San Mateo County housing market read across the ten Mid-Peninsula cities I track: Belmont, Burlingame, Foster City, Hillsborough, Menlo Park, Palo Alto, Redwood City, Redwood Shores, San Carlos, and San Mateo.
The short version:
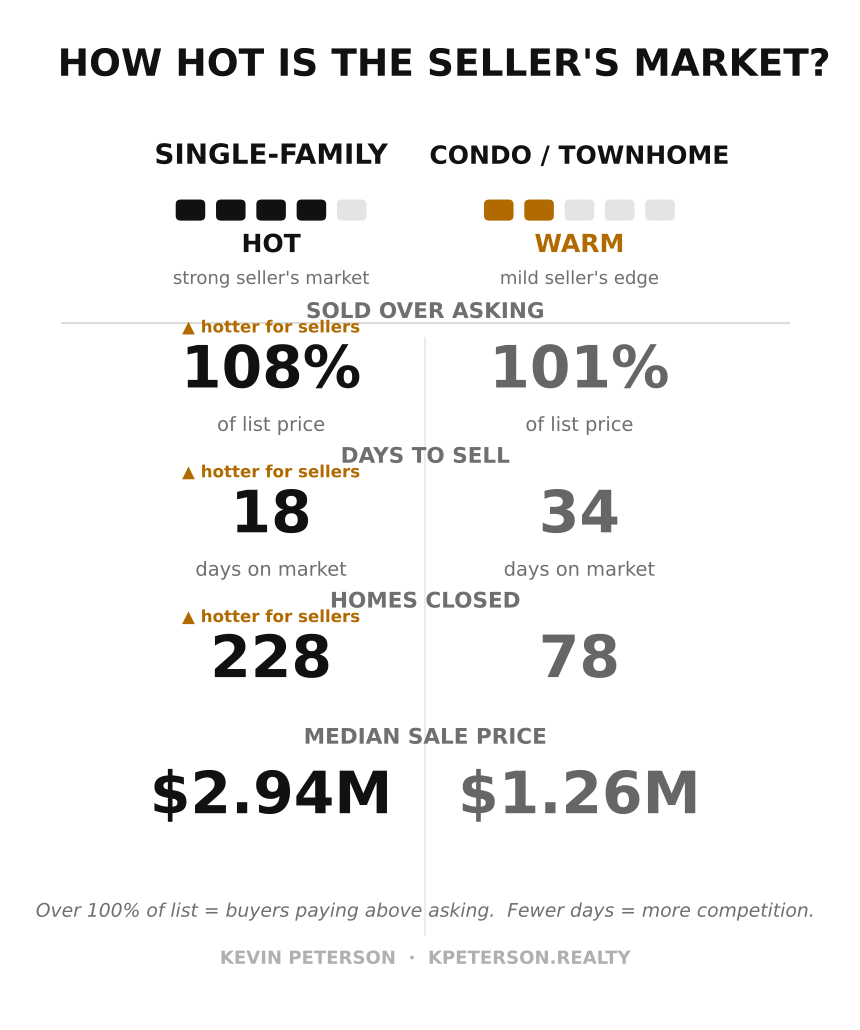
Sellers: Single-family homes sold at 108.3% of list in about 17 days (a median of 10.5), and every price band closed over asking.
Buyers: Condos and townhomes sold at 100.9% of list with a median of 17 days on market. This week's 14 condo closings averaged 98.8% of list, a bit softer than the 30-day pace.
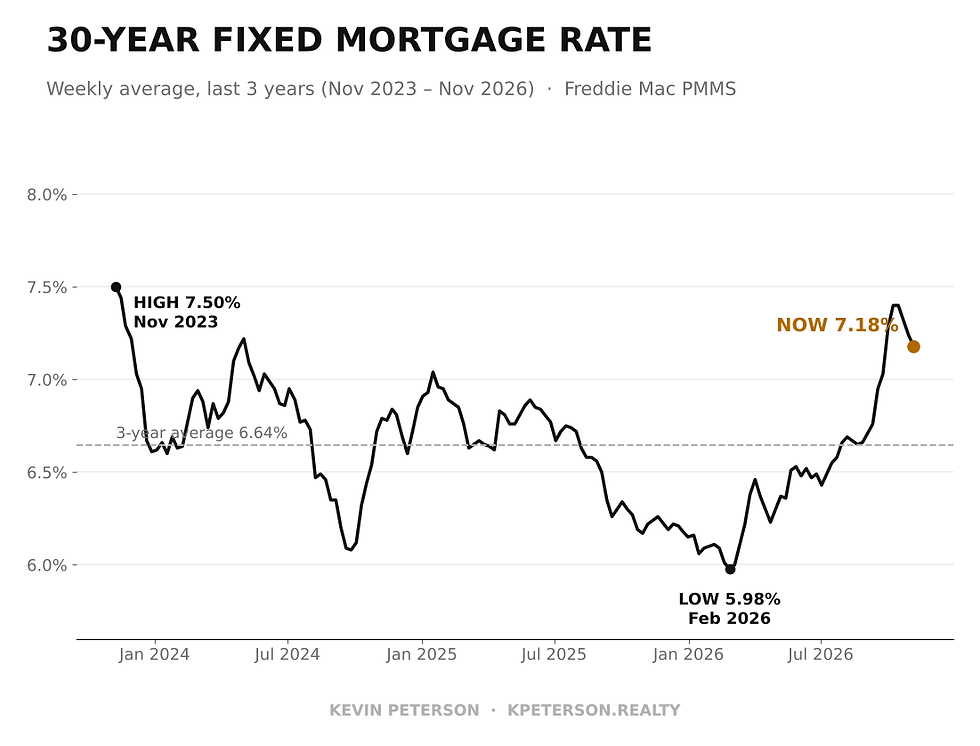
Rates: The 30-year fixed rate is 7.18% (Freddie Mac, November 5), down from 7.24% last week and up from 6.22% a year ago.
Inventory: Single-family listings are 242 active, 12% below a year ago, but they have stopped shrinking at the usual fall pace while new contracts slow.
The data: 303 closed sales in ten San Mateo County and Santa Clara County Peninsula cities, October 6 – November 5, from MLS Listings.

Local Market Activity (October 6 – November 5)
The Mid-Peninsula closed 303 homes in the last 30 days — 55 just this week. The typical home sold for $2.45M and went for 106.4% of asking, so sellers are still getting a premium over list.
Palo Alto (46), Redwood City (39) and San Mateo (38) led single-family volume, while Hillsborough ($6.08M) and Palo Alto ($3.83M) posted the highest medians. On the condo side, San Mateo (18) and Palo Alto (15) led volume, and Palo Alto had the highest median at $1.60M.

Single-Family by Price Point
Here's how the 224 single-family sales in the last 30 days broke down by price point:
Under $2M: 46 sold at 102% of list in about 23 days
$2–3M: 74 sold at 110.5% of list in about 15 days (the busiest tier, and the hottest by price paid over list)
$3–4.5M: 64 sold at 110.3% of list in about 12 days (the fastest tier)
$4.5M+: 40 sold at 108.1% of list in about 19 days
Over-asking isn't just an entry-level story here — it runs all the way up the price ladder.

This Week vs. the 30-Day Pace
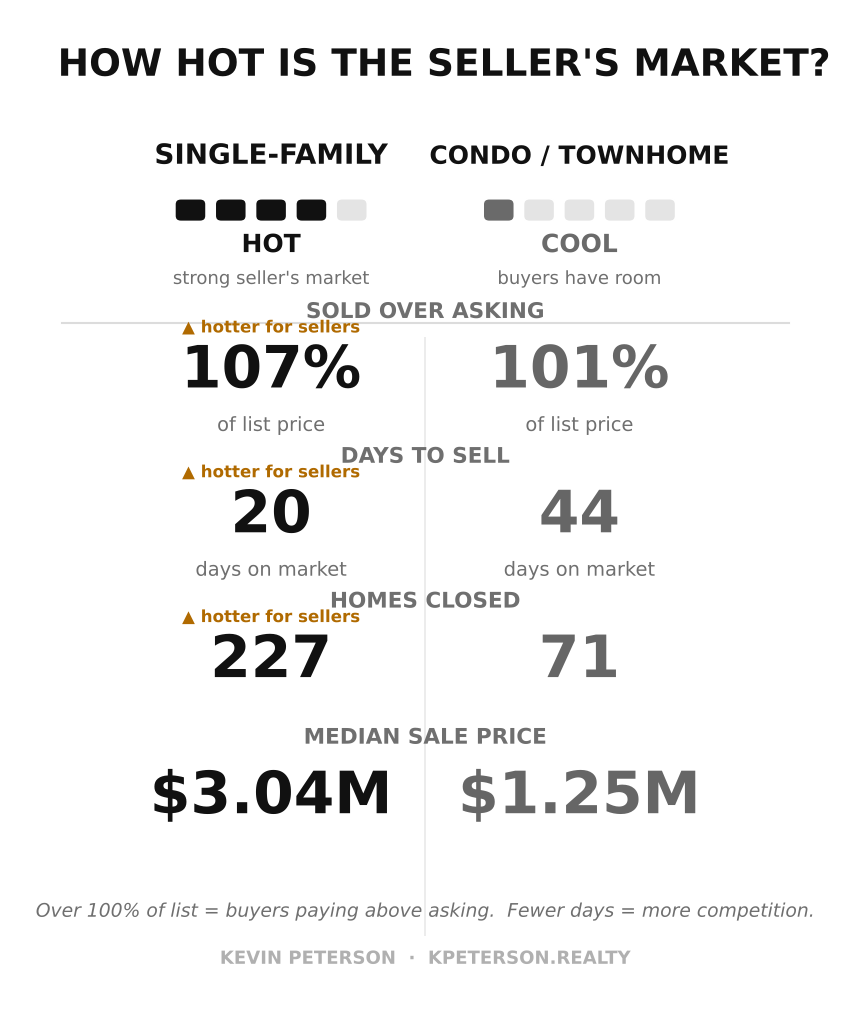
This week's 41 single-family closings sold at 107.1% of list in about 20 days (a median of 13), a touch cooler than the 30-day pace of 224 sold at 108.3% in about 17 days. Their median price was $2.80M versus $2.894M over 30 days, so a slightly lower-priced mix of homes closed this week. The 30-day single-family average is also pulled up by a few long-sitting listings (the longest took 168 days), which is why the median of 10.5 days is the better read.
Condos and townhomes: 14 closed this week at 98.8% of list, versus the 30-day pace of 79 sold at 100.9%. The 30-day condo average of about 30 days on market is inflated by long-sitting units (the longest took 184 days), so the better read is the median of 17 days (13 days this week).

Inventory: Active, Pending and Sold (3-Year View)
Is supply building or shrinking, and how fast? This compares the same ten cities this week with the same week in 2025 and 2024. Active means on the market and available, pending means under contract, and sold is a 4-week average of weekly closings.
Single-family: 242 homes are active, 12% fewer than the 276 a year ago and 11% fewer than the 272 in 2024. The gap is narrowing, though. Four weeks ago, inventory was 20% below last year (248 versus 309). In both 2025 and 2024, active listings dropped about 11% between early October and early November; this year they slipped only 2%.
Why? Contracts are slowing. Pending single-family listings fell from 176 to 145 in four weeks, down 18%, versus drops of 6% and 9% over the same stretch in 2025 and 2024. With fewer homes going under contract, fewer are leaving the active pool. Closings are averaging about 50 a week against 57.5 last year and 56 in 2024. At that pace, today's inventory is roughly 4.8 weeks of supply, the same as this week in each of the last two years, so the market is still tight.
Condos and townhomes: 200 are active, about 12% below last year's 226 and roughly even with 2024's 198. Pending is 61 (72 last year, 66 in 2024), and closings are averaging about 18 a week, which works out to roughly 11 weeks of supply (11.6 last year). That is more than double the single-family cushion, which is why condo buyers have more room to negotiate.

Bottom line: inventory is not building. Single-family supply is the lowest for this time of year in three years, and sellers still hold the edge. But the usual fall drop-off has nearly stopped while pending sales fall faster than normal. If contracts keep slowing, supply will begin to build into winter, and that is the number to watch in the coming weeks.
The Move Math
Here's what today's numbers mean for a move, using current medians and this week's 7.18% 30-year rate. (Payments are principal + interest, 20% down; taxes and insurance are on top.)
Trading up — condo to single-family:
Median condo/townhome at $1.275M: with 20% down and 80% financed, principal and interest is about $6,900/month, plus HOA. (Many condo buyers are investors or pay all cash.)
Median single-family home at $2.894M: principal and interest is about $15,700/month. (Buyers today often put 40–50% down or pay all cash because of rates and opportunity cost.)
The gap between the two: roughly $8,800/month.
Downsizing at 55+ — don't forget Prop 19.
Prop 19 lets homeowners 55 and older carry their existing low property-tax base to their next California home (up to three times, statewide). On a long-held home, that can mean keeping a tax bill tied to a $500–700K assessed value instead of today's price — often $20,000+ a year saved.
The Macro Corner.
Mortgage rates: The 30-year fixed averaged 7.18% (Freddie Mac, November 5), down from 7.24% last week and up from 6.22% a year ago. The 15-year was 6.57%.
The Fed: Held the target range at 3.75%–4.00% on October 28 in a 10–2 vote, with two members preferring a quarter-point hike. The next meeting is December 9, and futures were pricing a good chance of a hike.
Inflation: September headline CPI ran 3.7% year over year, core CPI 2.6%, and core PCE (the Fed's preferred gauge) 3.1%.
Wall Street: For the week ended October 30, the Dow slipped about 0.9%, the S&P 500 about 0.6% and the Nasdaq about 2.0%, with growth and tech names leading the pullback.
Bottom line: Rates are still elevated but have eased three weeks in a row from the 7.40% October peak, and local sellers still have pricing power.
Zooming out, this week's 7.18% sits just below the 3-year high of 7.50% (November 2023) and well above the 3-year low of 5.98% (February 2026), a climb of about 1.2 points since then. The 3-year average is 6.64%.
Bay Area Home Buyer and Seller FAQ
Is the San Mateo County housing market a seller's market right now?
Yes, for single-family homes. Over the last 30 days, 224 Mid-Peninsula single-family homes sold at 108.3% of list in about 17 days (a median of 10.5). Condos and townhomes are more balanced at 100.9% of list.
What is the median home price on the Mid-Peninsula?
Across all 303 closed sales in the last 30 days, the median sale price was $2.45M. Single-family homes had a median of $2.89M and condos/townhomes $1.275M. Single-family city medians ran from $2.20M in Redwood City to $6.08M in Hillsborough.
What are mortgage rates today, and what do they mean for a Bay Area move?
Freddie Mac's 30-year fixed rate was 7.18% on November 5, down from 7.24% last week and up from 6.22% a year ago. At that rate, principal and interest on the median condo (20% down) is about $6,900/month versus about $15,700/month for the median single-family home, a gap of roughly $8,800/month.
Is it easier to buy a condo or townhome than a single-family home?
Generally, yes on the numbers. Condos and townhomes sold at 100.9% of list with a median of 17 days on market, versus 108.3% and a median of 10.5 days for single-family homes, so buyers face less bidding pressure. Prices are also much lower, at a $1.275M median.
How does Prop 19 help Bay Area homeowners 55 and older who want to downsize?
Prop 19 lets homeowners 55 and older carry their existing low property-tax base to a replacement California home, up to three times. On a long-held home, that can mean keeping a tax bill tied to a $500–700K assessed value instead of today's price, often $20,000+ a year in savings. Check with a tax professional about your situation.
Which cities does this market report cover?
Belmont, Burlingame, Foster City, Hillsborough, Menlo Park, Palo Alto, Redwood City, Redwood Shores, San Carlos, and San Mateo, using closed sales from MLS Listings, October 6 – November 5. I use medians rather than averages because a few very high-priced or long-sitting sales can skew averages.
Want Your Personal Move Math?
Every move is different. Find out what your home is worth and run your own numbers: See what your home is worth →

Comments