
April 2025: Real Estate Trends in the SF Bay Area from San Mateo's Top Realtors
- Kevin Peterson
- May 16, 2025
- 14 min read

Who is KPeterson.realty and how can we help you?
The Data-Driven Realtor: With 40+ years of combined experience in global sales and management consulting, we offer advanced analytics and a unique scattergram analysis to provide unparalleled insights into your home's value and the local market. Each decision is supported by data, ensuring accuracy and confidence in your real estate journey.
Renovation Guidance: Planning renovations? We offer expert guidance on enhancements to optimize your return on investment. Our clients can also benefit from our reliable network of designers and contractors, with whom we have completed over 30 projects. Furthermore, we offer comprehensive project management for any home renovation project.
Exclusive Off-Market Opportunities: We go beyond the MLS by uncovering hidden gems. Each week, we personally connect with homeowners and leverage our network to find off-market properties tailored to your needs.
Financial Expertise: With 20+ years of experience in investing, lending, and tax strategies, we help clients navigate financing options, preserve wealth, and secure favorable terms.
KPeterson.realty Complimentary Listing Services
Luxury staging | Cleaning | Inspection: All provided at no cost to you!
Renovation & ROI Management: Maximize value with in-house contractors and project management
Financial & Tax Strategies: Expert advice on finance, diversification & wealth preservation
Pre-Market Agent Engagement: Early exposure to maximize visibility
Targeted Campaigns: Door knocking & postcards to drive significant open house traffic
Buzz-Worthy Open Houses: Captivating events, 7 days a week
Follow-Ups: Personal outreach to all visitors & agents
Digital Marketing: Paid & organic advertising to reach more buyers
Scattergram Pricing Analysis: Proprietary, data-driven strategy
Help us spread the word
If you believe our services or SF Bay Area real estate trends newsletter could be useful to someone you know, please pass along and let us know. We've got some KP swag that's cooler than a penguin in a snowstorm for you as a thank you!
Executive Summary: Five SF Bay Area Counties Proprietary Market Analysis
🔥 Sellers: The Market Is Still in Your Favor (For Now)
Where it's hottest:
San Mateo & Santa Clara Counties (SFRs & Townhomes):
Homes priced $1.3M–$3.5M are flying off the market.
Selling at 106%–110% of asking with DOM under 20 days.
Townhomes under $1.5M are moving especially fast.
San Francisco (Entry-Level Homes):
Condos under $800K and SFRs under $3M are seeing strong buyer interest.
Sale-to-list ratios around 105%.
Key stats:
SFRs still average 107% sale-to-list price.
Average DOM: 19 days (unchanged from March).
Months of Inventory: 1.9 – deep in seller's market territory.
🧊 Buyers: Be Strategic — Opportunity Is Growing
Where deals are happening:
San Francisco (Luxury Homes & Condos):
$4.5M+ SFRs and $1.8M+ condos = soft pricing, longer DOM, under 100% sale-to-list.
Contra Costa & Alameda Counties (Condos & High-End SFRs):
Sluggish performance above $2.5M.
Condos between $800K–$1.4M are lingering and negotiable.
Alameda County (Mid to High-End Condos):
Weak list-to-sale ratios and longer DOM.
More options and more leverage for buyers.
📊 Big Picture Trends: What You Need to Know
Inventory is up...
Active listings highest since mid-2022 for SFRs.
Condo inventory surged – reaching early-pandemic levels.
More listings = more choices for buyers, but demand is still strong for homes under $3.5M.
Appreciation over the last 10 years:
SFRs: +8.2% annually
Condos: +4.0% annually
Slower growth tied to HOA costs, investor returns, and post-pandemic preferences for space.
In this table, we summarize the price changes MoM (i.e. February versus March) and YoY (i.e. March 2025 versus March 2024).
County | Single-Family Homes | Condos |
San Mateo | Median Price: ~$1.96M | Median Price: ~$905,000 |
MoM: ▲ 0.5%, YoY: ▲ 7.0% | MoM: ~Flat YoY: ▲ 1.1% | |
Santa Clara | Median Price: ~$1.84M | Median Price: ~$845,000 |
MoM: ▲ 2.2%, YoY: ▲ 5.9% | MoM: ~Flat, YoY: ▲ 0.6% | |
San Francisco | Median Price: $1.25M | Median Price: $990,000 |
MoM: ▼ 3.8%, YoY: ▼ 9.7% | MoM: ▼ 2.0%, YoY: ▼ 8.8% | |
Alameda | Median Price: ~$1.15M | Median Price: ~$699,000 |
MoM: ▼ 2.5%, YoY: ▲ 2.3% | MoM: ▼ 1.4%, YoY: ~Flat | |
Contra Costa | Median Price: ~$785,000 | Median Price: ~$655,000 |
MoM: ▼ 10.3%, YoY: ▲ 2.0% | MoM: ▼ 3.6%, YoY: ~Flat |
💡 Key Takeaways
If you're a seller:
SFR in the $1.3M–$3.5M range? You’re golden. Prep it, price it right, and it’ll move fast.
Selling a condo? Expect more competition — standout marketing and pricing are critical.
Luxury home? Prepare to be patient or flexible on price.
If you're a buyer:
Looking under $2.5M? Be ready to compete — especially for updated SFRs, townhomes, and well-located condos.
Looking above $3M or buying a condo? You’ve got leverage — negotiate hard, and time is on your side.
Table of Contents:
SF Bay Area Real Estate Price Trends
KPeterson.realty Proprietary Heat Maps
The charts below are month-over-month and year-over-year heat maps of pricing in the SF Bay Area. They are grouped by county and property type (Condo, Single Family Home, Townhouse). The metrics are Price per Square Foot, Days on Market, how many sold, and the List to Sales Price Ratio. We've now also included average square footage at each price level.
Green highlighted cells indicate items keeping prices up in comparison to previous month's metrics.
Red highlighted cells indicate the opposite, i.e downward pressure on sales price which favor buyers more.
Enlarge each county Heat Map by clicking on each of the images.


🟢 Best Markets for Sellers
🔥 San Mateo County – Single-Family Homes & Townhomes
Why: DOM down across the board; homes between $1.3M–$3.5M selling 106%–110% of list
Townhomes in the $950K–$1.5M range are also flying off the shelf with <15 DOM
🔥 Santa Clara County – Single-Family Homes
Why: 836 homes sold, median $1,256/SqFt, avg. 10 DOM, sale-to-list up to 110%
Hot Price Ranges: $1.3M–$3.5M — move-up buyers and families are still competing hard
Also performing: Townhomes $800K–$1.5M (short DOM, 106%+ sale-to-list)
🔥 San Francisco County – Entry-Level Condos & SFRs
Why: <$800K condos selling at 105% of asking, and SFRs under $3M selling fast
Ideal for: Sellers of updated, well-located condos and homes under $2.5M–$3M
🔵 Best Markets for Buyers
🧊 San Francisco County – Luxury SFRs & Condos
Why: Homes $4.5M+ and condos $1.8M+ showing long DOM, softening $/SqFt, and list-to-sale ratios under 100%
Opportunity: Buyers can negotiate on trophy properties and wait for price adjustments
🧊 Contra Costa County – Condos & High-End SFRs
Why: Entry-level SFRs are strong, but condos and homes above $2.5M show stagnant or falling price/SqFt
Opportunity: Condos priced $800K–$1.3M are lingering longer and offer more room for negotiation
🧊 Alameda County – High-End & Mid-Tier Condos
Why: DOM remains elevated for condos, especially $1.3M+, with flat or declining list-to-sale ratios
Opportunity: Buyers in the $900K–$1.4M condo market can find less competition and negotiate terms
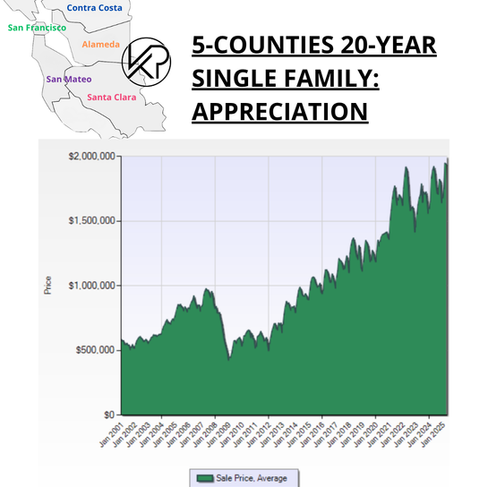
20-Year vs. 10-Year Appreciation
Bay Area single-family home prices have historically doubled every 10 years, thanks to a strong local economy and limited supply.
As of this month...
Single family home appreciation over 10 years = 8.2% per year
Condo appreciation over 10 years = 4.0% per year
Over the past decade, condos have experienced an appreciation rate of about three percent annually. This trend can be attributed to several factors, including HOA fees, which encompass insurance and maintenance inflation, as well as the challenges investors face in generating cash flow. Additionally, a post-pandemic shift has led many homeowners to seek more space, further impacting the condo market. Despite these challenges, there are still buying opportunities available for first-time homebuyers and investors.


SF Bay Area Inventory Metrics
Active Listings
The overall number of homes available on the market. An increased inventory combined with a slower selling rate typically benefits buyers, whereas decreased inventory and a faster selling rate usually benefit sellers.
Inventory Levels
Active Inventory Changes:
San Mateo: Single-family homes rose by 20%, while condos jumped 14%, indicating a shift toward a balanced market for condos.
Santa Clara: A 16% increase in single-family home inventory and 11% rise in condo inventory, both moving closer to a balanced market.
San Francisco: Both single-family homes and condos saw significant increases, with single-family home inventory rising by 22% and condos by 12%.
Alameda & Contra Costa: Moderate increases in single-family home inventory (7-8%) and larger increases in condo inventory (12%).
20-Year vs. 10-Year Inventory Levels
Every year we see active and sold inventory go up then down, a predictable cadence. How high or low is dependent on the next metric, Months of Inventory or the rate of change in inventory being sold.
In 2024, we saw historically low inventory levels (below 2,300 active single family home listings across the five counties); active inventory has now rebounded above 4,000 active listings. If this trend continues, there could be some downward pressure on sales prices due to the amount of supply being on. the market.
The graphs below show both a 20-year and 10-year time horizon for both single family homes and condos that are on the market (active) versus sold.


🏡 Single-Family Homes – April 2025
Active listings increased to the highest level since mid-2022, but not yet near pre-COVID highs.
Sales volume has remained steady, creating a more balanced yet competitive market.
The gap between active and sold listings is wider than in Spring 2022, but still tighter than the big gaps seen in 2018–2020.
Interpretation: Inventory is rising, giving buyers a few more options, but strong demand (especially in the $1.3M–$2.5M range) is still absorbing listings quickly. This supports the low DOM and 107% sale-to-list price observed in April.
🏢 Condominiums – April 2025
Active condo listings have surged, reaching levels not seen since mid-2020 and early 2021.
Sales volume remains relatively low, causing a widening gap between available and sold units.
The result is a clear buyer's market dynamic—condos are sitting longer and sellers have less leverage.
This aligns with the 3.9 months of inventory and weaker sale-to-list ratios seen in other charts, confirming that buyers are more cautious or selective with condos.
🧠 Final Takeaway
Sellers of single-family homes are still in a strong position, but rising inventory means pricing and presentation matter more than ever.
Condo sellers face headwinds: more competition and fewer buyers pulling the trigger. Strategic pricing and standout marketing will be key to getting into contract.
Months of Supply
The time it would take to sell all active listings at the current sales rate.
20-Year vs. 10-Year Months of Supply
This metric tells us how hot the markets are currently, i.e. the rate of change. If no new listings were added, this metric tells us how long it would take to sell all the remaining active homes. In the last 10 years, we have been in a Seller's Market except for condos in the year of 2020, when the COVID Pandemic hit.
Buyer's Market = Over 6 months of supply
Seller's Market = Under 3 months of supply


🏡 Single-Family Homes – April 2025
Months of Inventory = 1.9, keeping single-family homes firmly in a seller’s market.
While inventory has ticked up slightly, it's still well below the 3-month neutral threshold, meaning demand is still outpacing supply.
This suggests strong buyer activity and limited inventory, especially in the $1.3M–$3.5M price range where pending activity was highest.
🏢 Condominiums – April 2025
Months of Inventory = 3.9, putting condos into a neutral-to-buyer’s market territory.
This is the highest inventory level in over a year, signaling that buyers have more options and sellers face increased competition.
Compared to early 2024 when inventory was closer to 2 months, April shows a cooling trend in the condo market—possibly a result of tech layoffs or affordability ceilings.
🔍 Bottom Line
Single-family homes remain competitive with low inventory and fast-moving sales.
Condo inventory has climbed, giving buyers more leverage and softening pricing power for sellers—especially in higher price points.
The divergence highlights the importance of pricing and prep, especially for condo sellers who now face a more crowded market.
Demand Indicators
% Over Asking vs. DOM (12-Month Look Back)
How much over asking a home sold for and how fast it was sold, i.e. Days On Market are the next two Key Performance Indicators (KPIs). These show how much demand there is for SF Bay Area single family homes and condos.
Days On Market measures how long it takes for homes to sell.
Buyers: Longer DOM gives more room for negotiation.
Sellers: Shorter DOM indicates strong interest.


🏡 Single-Family Homes – April 2025
DOM stayed flat at 19 days, holding steady from March and representing the fastest sales pace since May 2024.
Sale-to-List Price Ratio stayed strong at 107%, reflecting continued high demand and multiple-offer situations in the single-family space.
Unlike condos, single-family homes never dipped below 103%, even during the winter, showing much more resilient demand year-round.
🏢 Condominiums – April 2025
DOM improved to 35 days, the fastest pace since September 2024 and a big drop from the peak of 61 days in January 2025.
Sale-to-List Price Ratio rebounded to 101.5%, the highest point in a full year—suggesting renewed competition and bidding on condos.
Compared to the slow, buyer-favorable winter (Nov–Jan), April shows clear signs of a condo market recovery, with faster sales and stronger pricing power for sellers.
Pending Sales
Homes under contract, i.e. Pending, show how quickly the market is moving.
The graphics below display the pending sales for all five counties, categorized by home types and price levels. The price tiers with the highest volume of pending sales for each home type and county are highlighted in yellow. For example, in San Mateo County, the most condos are sold at prices below $800K, while the most single-family homes and townhouses are sold between $800K and $1.3M. The color coding or heat map indicates changes compared to the previous month, with positive impacts on sales prices highlighted in green and negative impacts highlighted in red.

April was a tale of two markets: strong demand in affordable and mid-range homes, but continued weakness at the luxury end. Here’s what stood out across the Bay Area:
📈 Where the Market is Hot
Condos and townhomes under $1.3M saw strong buyer interest across San Mateo, Santa Clara, Alameda, and Contra Costa counties. Green indicators (higher $/SqFt, lower Days on Market, more pendings) lit up the charts.
Single-family homes priced $1.8M–$3.5M were on fire in San Mateo (302 pendings) and Santa Clara (641 pendings)—a clear sign of move-up buyers making their move.
San Francisco condos under $800K rebounded, with 22 homes pending and pricing momentum recovering—likely from return-to-city buyers and investors.
🧊 Where the Market is Cooling
Luxury homes over $4.5M remained sluggish across all counties. Red flags everywhere: longer days on market, price cuts, and very few pending sales.
High-end San Francisco single-family homes and townhouses ($3M+) continued to drag, with buyers sitting on the sidelines.
Contra Costa and Alameda showed strong activity under $1.3M, but struggled above $2.5M—buyers are staying price-conscious.
💡 Key Takeaway for Buyers & Sellers
If you’re a buyer in the $800K–$2.5M range, expect competition—especially for updated condos, townhomes, and entry-level single-family homes.
If you’re a seller in that sweet spot, the data is on your side. Prep it well, price it right, and it should move quickly.
Luxury sellers may need to adjust pricing expectations or offer more incentives—this segment remains slow despite broader market strength.
Macroeconomics
Mortgage Rates
Month-over-Month Change:
Rate Trends: The average 30-year fixed mortgage rate hovered around 6.7% to 6.8% for much of April, reflecting a slight increase from the previous month. For instance, on April 25, the rate was reported at 6.90% , while by April 28, it dipped slightly to 6.769% .
While economic uncertainty often leads to lower mortgage rates due to a flight to safety, factors like inflation, Fed policy, and Treasury yields can counterbalance this effect. In April 2025, inflation concerns and the Fed's stance on tightening monetary policy contributed to higher mortgage rates despite the broader economic uncertainty.


10-Year Treasury (correlated to 30 year mortgages)
In April 2025, the U.S. 10-year Treasury yield experienced significant volatility, influenced by President Trump's trade policies and market reactions.
Early April Decline: The yield fell below 4% for the first time since October 2024, reaching 3.86% on April 4, amid recession concerns and expectations of Federal Reserve rate cuts. WSJ
Mid-April Surge: Following the announcement of sweeping tariffs on April 2, the yield spiked to 4.5% by April 9, marking its biggest weekly increase in over two decades. Reuters
Post-Tariff Stabilization: After a 90-day tariff pause was announced on April 9, yields began to stabilize, with the 10-year yield reaching 4.374% by May 11. Barron's
Stock Market (Performance in April 2025)
The U.S. stock market experienced significant volatility in April 2025, driven by trade policy shocks, recession fears, and economic contraction in Q1. The S&P 500 declined 0.76%, while the Dow Jones dropped 3.17%, and the Nasdaq saw a modest gain of 0.88%.
Retail investor activity surged, contributing to market rebounds, and a pause in tariff hikes helped ease trade tensions, but ongoing concerns about inflation and economic growth persisted.
Tech stocks, particularly in AI, saw strong performance with companies like Nvidia and AMD rallying after the government eased AI technology restrictions, while the broader tech sector faced challenges amid ongoing layoffs and policy uncertainty.
FED (Federal Reserve)
In April 2025, the Federal Reserve held interest rates steady at 4.25% to 4.5% for the third straight meeting, signaling a cautious stance amid ongoing economic uncertainty.
This decision reflects the Fed's assessment of solid economic activity and a resilient labor market, despite recent challenges such as a surprise 0.3% contraction in first-quarter GDP and rising inflation pressures. Kiplinger
Inflation
The consumer price index declined to 2.3% in April from 12 months earlier, the lowest level since February 2021. CNBC
Employment
U.S. Employment:
April’s jobs report underscored the labor market’s resilience in the face of trade policy uncertainties and recent market volatility.
The U.S. economy added 177,000 jobs in April, beating expectations of 138,000. However, there were net downward revisions of 58,000 to the prior two months.
The unemployment rate remained steady at 4.2%, as the labor force participation rate continues to edge up. J.P.Morgan
Bay Area Employment:
Although February saw the highest total number of layoffs in one month since the pandemic, April stands out for topping the number of tech layoffs within a single month. These layoffs were primarily driven by a strategic pivot towards AI and automation, leading to the elimination of roles deemed less essential in the evolving tech landscape.
April saw over 23,400 combined layoffs across various technology companies, which is about three times as much as March 2025
Headliners include Intel, with the largest announced share of job cuts last month (21,000), as well as other big names like Expedia, Meta, Turo, Microsoft, and even Automattic (the parent company behind WordPress). Forbes
Overall, while some sectors like tech and biotech face challenges, the Bay Area real estate market will continue to be shaped by shifts in employment, housing demand, and broader economic dynamics.
Working in the SF Bay Area
Remote Work (aka Work From Home)
In April 2025, Silicon Valley's remote work landscape continued to evolve, with notable shifts in company policies and employee responses.
Return-to-Office Mandates Intensify
Several major tech companies reinforced their return-to-office (RTO) policies:
Google: Employees in specific teams, such as technical services and people operations, were required to work in the office three days per week or risk losing their roles. Some employees were offered relocation expenses to move within 50 miles of an office . News.com.au
Apple: Increased in-office requirements to one day per week in April, ramping up to three days per week by May.
Uber: Increased its in-office requirement from two to three days a week and announced plans to expand its office space in San Francisco and Seattle by 700,000 square feet through 2026 .
Office Space
Sublease Availability Decreases
The amount of office space available for sublease decreased from 7.9 million square feet at the end of 2024 to 7.1 million square feet in the first quarter of 2025, suggesting a slight improvement in the market.
Vacancy Rates
Despite new leases, San Francisco's office vacancy rate slightly increased to 35.8% by the end of Q1 2025, influenced by ongoing remote work preferences and available sublease space . CBRE
Startups
In April 2025, the San Francisco Bay Area's startup ecosystem experienced a dynamic shift, marked by significant layoffs alongside robust venture capital activity, particularly in artificial intelligence (AI) and clean energy sectors.
OpenAI secured a massive $40 billion funding round, underscoring the growing investor confidence in AI technologies. Axios
Exowatt, a renewable energy startup focusing on AI data centers, raised $70 million in Series A funding to support the deployment of its modular energy platform.
Redpanda Data, specializing in real-time data streaming, obtained $100 million in Series D funding, highlighting the demand for efficient data infrastructure.
Additionally, the Bay Area captured 73% of North America's AI-related venture funding, emphasizing its position as a leading hub for AI innovation. Nucamp
To subscribe:


Comments