
December 2025: Real Estate Trends in the SF Bay Area from San Mateo's Top Realtors
- Kevin Peterson
- Jan 8
- 11 min read

Updated: Jan 12
Who is KPeterson.realty and how can we help you?
The Data-Driven Realtor: With 40+ years of combined experience in global sales and management consulting, we offer advanced analytics and a unique scattergram analysis to provide unparalleled insights into your home's value and the local market. Each decision is supported by data, ensuring accuracy and confidence in your real estate journey.
Renovation Guidance: Planning renovations? We offer expert guidance on enhancements to optimize your return on investment. Our clients can also benefit from our reliable network of designers and contractors, with whom we have completed over 30 projects. Furthermore, we offer comprehensive project management for any home renovation project.
Exclusive Off-Market Opportunities: We go beyond the MLS by uncovering hidden gems. Each week, we personally connect with homeowners and leverage our network to find off-market properties tailored to your needs.
Financial Expertise: With 20+ years of experience in investing, lending, and tax strategies, we help clients navigate financing options, preserve wealth, and secure favorable terms.
Help us spread the word
Click HERE to discover how the SF Bay Area real estate markets have been evolving along side our local Silicon Valley as well as the U.S. and global economies.
And if you believe this monthly newsletter could be useful to someone you know, please pass along and let us know!
SF Bay Area Real Estate Market Update — December 2025
What Year-End Really Told Us About 2026
December 2025 quietly delivered one of the most important signals of the year for SF Bay Area real estate trends. Despite seasonality, stable mortgage rates, cooling inflation, and a slowing labor market, prices did not reset, inventory tightened in key segments, and buyer leverage narrowed more than expected—especially for single-family homes.
Rather than capitulating into the holidays, many sellers chose to hold firm or pull listings, while serious buyers continued to transact where value and scarcity aligned. The result was a highly segmented market: single-family homes in core price bands stayed resilient, while condos, townhomes, and discretionary tiers remained negotiable.
December wasn’t about momentum—it was about discipline. And that discipline now sets the tone for how buyers, sellers, and investors should think about January and Spring 2026.
Executive Summary — What December Taught Us About 2026
For Buyers
The traditional “holiday discount” is no longer guaranteed, particularly for single-family homes in supply-constrained markets.
Off-season leverage narrowed in core Peninsula and tech-centric submarkets.
Condos and luxury tiers still offer negotiation windows—but timing and selectivity matter.
For Sellers
December validated the strategy of not over-discounting out of fear.
Well-positioned, high-quality homes proved they can sell year-round.
Spring 2026 is likely to open with more competition than many expect, not less.
For Investors
Broad bargains remain scarce, but selective entry points persist in condos and upper-luxury segments where time—not distress—is pressuring sellers.
Tight Peninsula single-family supply continues to underpin long-term value stability.
Peninsula Market Snapshot — December 2025
City / Submarket | Median SFR Price | Median Condo Price | DOM | Mos. Supply | Trend (MoM) | Market Lean |
Palo Alto | ~$3.6M | ~$1.1M–$1.6M | Low-30s | ~1.9 | Stable | Seller |
Redwood City | ~$1.85M–$1.9M | ~$800K–$1.2M | ~26 | ~2.0 | Stable | Seller |
San Mateo | ~$2.8M–$3.0M | ~$900K–$1.3M | ~30 | ~2.0 | Stable | Seller |
Belmont | ~$2.4M–$2.6M | ~$900K–$1.2M | ~30 | ~2.2 | Flat | Balanced |
Foster City | ~$2.2M | ~$700K–$1.0M | Mid-30s | ~2.2 | Flat | Balanced |
San Carlos | ~$2.9M | ~$800K–$1.3M | ~27 | ~1.9 | Stable | Seller |
Burlingame | ~$3.1M–$3.3M | ~$900K–$1.4M | ~30 | ~2.0 | Stable | Seller |
Redwood Shores | ~$2.6M–$2.8M | Limited condo data | ~30 | ~2.0 | Flat | Seller |
Hillsborough | ~$4M+ | N/A | ~30+ | ~2.1 | Flat | Luxury soft |
Key takeaway: Peninsula single-family homes largely ignored seasonal weakness, while condos remained slower but did not materially deteriorate. Inventory tightened into year-end rather than expanding — a notable deviation from historical December patterns.
Key Housing Metrics: Nov → Dec 2025
Metric | Nov 2025 | Dec 2025 | Trend |
Median SFR Price (Bay Area) | ~$1.84M | ~$1.84M–$1.85M* | ➡ Stable |
Median Condo Price | ~$895K | ~$890K–$900K* | ➡ Flat |
SFR DOM | ~29 days | ~28–30 days* | ➡ Stable |
Condo DOM | ~50 days | ~50–52 days* | ➡ Flat |
SFR Months Of Supply | ~2.1 | ~1.9–2.0* | ⬇ |
Condo Months of Supply | ~3.7 | ~3.6–3.8* | ➡ |
*Estimated based on monthly closings, inventory contraction, and seasonal norms.
Table of Contents:
SF Bay Area Real Estate Price Trends
KPeterson.realty Proprietary Heat Maps
The charts below are month-over-month and year-over-year heat maps of pricing in the SF Bay Area. They are grouped by county and property type (Condo, Single Family Home, Townhouse). The metrics are Price per Square Foot, Days on Market, how many sold, and the List to Sales Price Ratio. We've now also included average square footage at each price level.


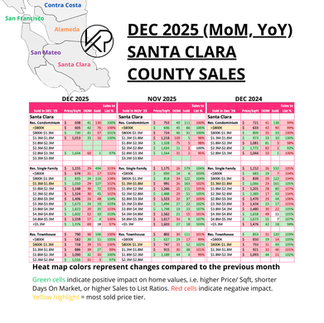


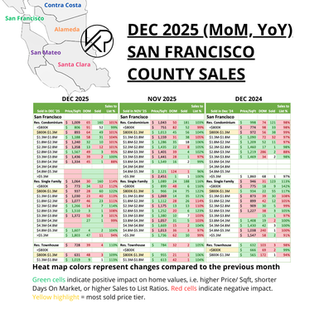
Green highlighted cells indicate items keeping prices up in comparison to previous month's metrics.
Red highlighted cells indicate the opposite, i.e downward pressure on sales price which favor buyers more.
Enlarge each county Heat Map by clicking on each of the images.
20-Year vs. 10-Year Appreciation
Bay Area single-family home prices have historically doubled every 10 years, thanks to a strong local economy and limited supply. Average sale price remained near the all-time high, showing continued strength.
As of this month...
Single family home appreciation over 10 years = 8.5% per year
Condo appreciation over 10 years = 3.3% per year


SF Bay Area Inventory Metrics
Active vs. Sold Listings
Active listings are homes currently on the market, while sold listings reflect homes that have successfully closed. When sold listings outpace active ones, it signals strong demand and favors sellers with faster sales and higher prices; when active listings outnumber sold ones, it suggests more supply and gives buyers more negotiating power and choice.


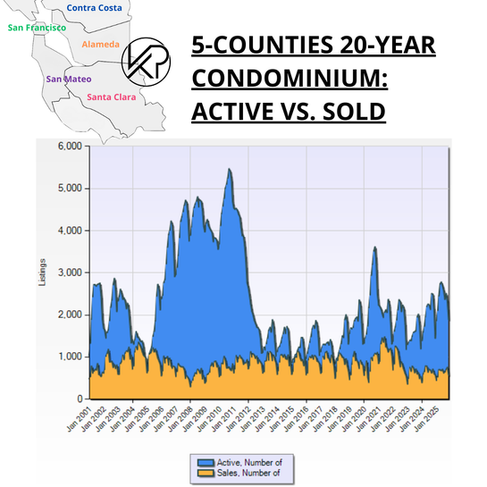


Active vs. Sold Listings
In December 2025, active listings fell faster than sales slowed, especially for single-family homes, which is atypical for December and signaled that sellers pulled inventory off the market rather than discounting.
Sold volume dipped seasonally, but absorption remained healthy, meaning serious buyers continued to transact even as casual shoppers stepped aside.
The Active-to-Sold gap narrowed into year-end, reinforcing that supply, not demand, was the dominant constraint — a setup that increases competitive pressure heading into early 2026.
Months of Supply
The time it would take to sell all active listings at the current sales rate.
20-Year vs. 10-Year Months of Supply
This metric tells us how hot the markets are currently, i.e. the rate of change. If no new listings were added, this metric tells us how long it would take to sell all the remaining active homes. In the last 10 years, we have been in a Seller's Market except for condos in the year of 2020, when the COVID Pandemic hit.
Buyer's Market = Over 6 months of supply
Seller's Market = Under 3 months of supply


Single-Family Homes – Months of Inventory (SF Bay Area, December 2025)
In December 2025, single-family home inventory tightened further to roughly ~1.3–1.4 months, remaining well below neutral levels and underscoring an unusually firm seller-leaning market for a holiday period.
MoM: Active listings declined faster than seasonal sales volume, preventing the typical December inventory buildup.
YoY: Inventory stayed materially below the ~3.0-month neutral benchmark, reinforcing long-term supply constraints.
Impact: Sellers retained leverage under ~$3.4M; buyers faced limited selection even off-season; investors found few forced discounts in core SFR segments.
Condominiums – Months of Inventory (SF Bay Area, December 2025)
In December 2025, condominium inventory hovered near ~3.5–3.7 months, remaining elevated and signaling a continued buyer-leaning environment despite modest year-end stabilization.
MoM: Inventory levels held steady as new listings slowed, but buyer absorption remained selective.
YoY: Inventory stayed above pre-pandemic norms, reflecting ongoing affordability and HOA sensitivity.
Impact: Buyers maintained negotiating leverage; sellers experienced longer timelines; investors identified selective entry points, particularly in well-located or repositioned assets.
Demand Indicators
% Over Asking vs. DOM (12-Month Look Back)
The SF Bay Area housing market shows a clear inverse relationship between Days on Market (DOM) and Sale-to-List Price Ratios:as DOM decreases, homes sell further above list; as DOM increases, pricing power weakens.
This relationship holds consistently across both single-family homes and condominiums, validating that pricing outcomes are driven by absorption speed—not sentiment or headline rates.


What Buyers, Sellers, and Investors Faced in December 2025 (SF Bay Area)
Buyers: Lower overall activity but less off-season leverage than expected—single-family homes remained competitive with limited inventory, while condos continued to offer the clearest negotiating opportunities for well-prepared buyers.
Sellers: A year-end bifurcation—single-family sellers largely held firm on pricing as inventory tightened, while condo sellers faced longer timelines and needed sharper pricing or incentives to maintain momentum.
Investors: Broad discounts remained scarce, but targeted opportunities persisted in condo and select townhome segments where elevated inventory and extended days on market created patient entry points rather than forced sales.
Pending Sales
Homes under contract, i.e. Pending, show how quickly the market is moving.
The graphics below display the pending sales for all five counties, categorized by home types and price levels. The price tiers with the highest volume of pending sales for each home type and county are highlighted in yellow. For example, in San Mateo County, the most condos are sold at prices below $800K, while the most single-family homes and townhouses are sold between $800K and $1.3M. The color coding or heat map indicates changes compared to the previous month, with positive impacts on sales prices highlighted in green and negative impacts highlighted in red.

Buyer leverage clustered in payment-sensitive and discretionary tiers: mid-market condos, entry-level SFHs, and upper-luxury homes across all counties went all-red as affordability ceilings, HOA friction, and optionality caused buyers to slow, stretch DOM, and reduce Pendings.
Mid-tier SFHs weren’t immune in December: San Mateo ($1.3M–$2.8M) and multiple Alameda, Contra Costa, and Santa Clara SFR bands turned all-red as buyers paused after a strong fall run-up, choosing to wait for spring inventory rather than compete during the holidays.
Lower-priced townhomes consistently favored buyers: <$800K–$1.3M townhome tiers across counties underperformed as buyers either upgraded to SFHs or stepped down to condos, leaving these bands squeezed with longer timelines and weaker absorption.
Why this is happening (December 2025):
Buyers hit affordability and optionality limits at the same time. Payment-sensitive bands (entry SFHs, mid-tier condos, lower townhomes) and discretionary bands (upper-luxury) stalled as buyers recognized they could either wait a few weeks for spring inventory or re-trade across property types without penalty.
Seasonal urgency disappeared — but pricing didn’t reset. Sellers largely did not discount into December. Without price relief, buyers simply paused, stretching DOM and weakening Pendings across many bands — turning them all-red even though macro conditions hadn’t worsened.
Only scarcity overpowered seasonality. The few all-green tiers (San Mateo condos $1.8M–$2.3M and SF SFRs $2.8M–$3.3M) had limited substitutes and highly intentional buyers. Everywhere else, buyers exercised patience instead of competing.
Macroeconomics
Mortgage Rates
Mortgage rates remained range-bound in December 2025, with the 30-year fixed rate hovering near ~6.1–6.3%. While rates stayed near their lowest levels of the year, the modest affordability relief seen earlier in the fall no longer influenced buyer urgency.
Lower rates helped sustain baseline demand, particularly in core single-family price tiers, but did not offset seasonal selectivity. Buyers became increasingly disciplined around monthly payments, HOA costs, and price-to-value alignment—especially in condos and discretionary upper-end segments.
Key takeaway: By December, mortgage rates were a background condition, not a driver. Buyer behavior was governed by price ceilings, inventory scarcity, and optionality—not financing costs—setting the tone for a selective and segmented start to 2026.


10-Year Treasury
Yields drifted modestly higher and stayed range-bound (~4.2%–4.3%), reversing November’s slight optimism and confirming that markets were not pricing near-term rate cuts.
Investors continued to expect gradual easing in 2026, not imminent relief, which prevented yields from breaking below the key ~4.0–4.1% support level.
Heavy Treasury issuance and fiscal pressure capped any downside, keeping long-term yields elevated despite cooling inflation data.
How This Impacts January 2026 Buyers and Sellers
Buyers
January mortgage rates are likely to open near December levels (~6.1%–6.3%), meaning affordability conditions will feel unchanged.
Without a Treasury break lower, buyers will remain selective and payment-disciplined, focusing on value rather than urgency.
Sellers
Sellers should not expect a rate-driven demand surge in January.
Pricing and inventory positioning—not financing tailwinds—will determine whether homes gain traction early in the year.
Key Takeaway
December confirmed that rates are stable, not catalytic. Unless the 10-year Treasury breaks meaningfully lower, January activity will be driven by inventory scarcity and buyer selectivity, not cheaper money.
Stock Market
Stocks stabilized, not surged: The S&P 500, QQQ, and the Magnificent 7 held most 2025 gains in December but lost momentum, preserving confidence without creating new wealth or urgency.
Housing reflected confidence, not acceleration: December real estate activity stayed selective—buyers remained active where inventory was scarce, but condos and discretionary tiers saw pauses as stock gains didn’t loosen price sensitivity.
January setup remains inventory-driven: Buyers enter January confident but not newly capitalized; unless earnings surprise meaningfully, early-2026 housing outcomes will hinge on inventory scarcity and pricing discipline—not stock market gains.
FED (Federal Reserve)
In December 2025, the Fed continued easing with a quarter-point rate cut, but with clear internal debate and cautious guidance — setting the stage for a data-dependent start to 2026 where rates may be stable rather than dramatically lower, and where housing demand will be shaped more by inventory and buyer calculus than by new rate repricing.
Inflation
Inflation continued to cool modestly in December, with headline CPI near ~2.6–2.7% YoY and core inflation easing slightly but remaining elevated around ~2.8–2.9%, led by persistent services and housing costs.
Shelter inflation slowed further, helping cap mortgage rates, but housing remained the largest contributor to overall inflation.
Key Takeaway
Inflation progress supported rate stability—not rate relief. Mortgage rates stayed near ~6.1–6.3%, keeping buyers engaged but affordability constrained, leaving inventory and absorption—not inflation— as the primary drivers of Bay Area housing prices heading into January 2026.
Employment
Entry-level & payment-sensitive tiers felt it firstHomes below ~$1.3M (condos, townhomes, and some SFHs) showed more buyer hesitation as tech and white-collar hiring cooled. Even modest job uncertainty made buyers at these price points more cautious about monthly payments and job mobility, shifting leverage toward buyers.
Mid-tier single-family homes stayed resilientThe $1.3M–$3.3M SFH range—especially on the Peninsula and in strong commute corridors—was less impacted. Buyers here tend to be dual-income, well-capitalized, and less sensitive to short-term employment noise, so demand held where inventory was tight.
Upper-end and luxury tiers paused due to discretion, not distressHomes above ~$3.8M slowed as buyers exercised optionality. This wasn’t driven by layoffs, but by confidence that waiting carried little risk in a market without urgency. As a result, leverage shifted to buyers despite stable employment overall.
Key Takeaway
Rising unemployment didn’t weaken the Bay Area market evenly — it pressured affordability-driven tiers, spared core move-up SFHs, and slowed luxury segments through discretion rather than fear.
Working in the SF Bay Area
Work Patterns & Mobility — December 2025
Hybrid work remains dominant: Bay Area employers continued pushing for structured in-office routines while retaining flexibility. Surveys have shown hybrid schedules (typically 3–4 days in office) are now the norm for most workers across tech and professional sectors. Bay Area Economy
Slight shift toward more in-office days: Employers increasingly prioritize collaboration, with more mid-week office attendance reported (Tuesday–Thursday).
No reversal to full remote: Fully remote roles stayed scarce, with most workers still splitting time between home and office.
Housing implication: Hybrid schedules continue to support demand in Peninsula and close-in suburban markets, where flexibility and manageable commutes remain a priority.
Regional Transit Trends — December 2025
Transit usage steady but uneven: Weekday transit ridership stabilized rather than surged, reflecting hybrid commutes and fewer full-time in-office days.
Commuting patterns evolving: Increased weekday office attendance on certain days suggests transit demand is slowly broadening, though not returning to pre-pandemic peaks.
Car usage still strong: With hybrid schedules blunting traditional rush hours, many commuters continued to drive rather than rely solely on transit.
Housing implication: Transit improvements help, but housing demand still favors areas with flexible commute options, not just strict proximity to transit hubs.
Office Space & Leasing Dynamics — December 2025
Tech and AI continue to shape office demand: San Francisco and Silicon Valley have seen increased office leasing and commercial real estate activity, particularly driven by AI and large tech firms gearing up for growth. (Globest)
Leasing remains selective: Demand concentrated in high-quality, flexible spaces rather than broad reinstatement of pre-pandemic office footprints.
Creative reuse and repositioning: Some office properties are being repurposed or absorbed by expansion in adjacent sectors (such as flexible workspaces tied to tech growth). (Globest)
Housing implication: Office usage patterns reinforce Peninsula and close-in suburban price support, but do not signal a full return to five-day downtown commutes.
Startups & Venture Capital — December 2025
VC activity remains concentrated but healthy: National venture capital funding continued to flow, with technology and AI sectors capturing the majority of capital. San Francisco and the Bay Area retained a disproportionate share of this activity, supporting local job stability. Globest
Larger deals dominate: Investors favored established later-stage rounds with clear revenue trajectories, while seed-stage activity remained subdued.
Housing implication: VC trends supported income stability and confidence for tech-oriented households, but did not create speculative housing demand—reflecting a disciplined, inventory-driven housing market.
Bottom Line — December 2025
Together, these signals reinforce that housing demand continues to be driven by inventory, commute flexibility, and job stability, not by a sudden surge in downtown office demand or speculative investment behavior heading into January 2026.
To subscribe:


Comments