
October 2025: Real Estate Trends in the SF Bay Area from San Mateo's Top Realtors
- Kevin Peterson
- Dec 15, 2025
- 13 min read

Who is KPeterson.realty and how can we help you?
The Data-Driven Realtor: With 40+ years of combined experience in global sales and management consulting, we offer advanced analytics and a unique scattergram analysis to provide unparalleled insights into your home's value and the local market. Each decision is supported by data, ensuring accuracy and confidence in your real estate journey.
Renovation Guidance: Planning renovations? We offer expert guidance on enhancements to optimize your return on investment. Our clients can also benefit from our reliable network of designers and contractors, with whom we have completed over 30 projects. Furthermore, we offer comprehensive project management for any home renovation project.
Exclusive Off-Market Opportunities: We go beyond the MLS by uncovering hidden gems. Each week, we personally connect with homeowners and leverage our network to find off-market properties tailored to your needs.
Financial Expertise: With 20+ years of experience in investing, lending, and tax strategies, we help clients navigate financing options, preserve wealth, and secure favorable terms.
Help us spread the word
Click HERE to discover how the SF Bay Area real estate markets have been evolving along side our local Silicon Valley as well as the U.S. and global economies.
And if you believe this monthly newsletter could be useful to someone you know, please pass along and let us know!
Executive Summary — Peninsula & SF Bay Area
October 2025 brought a layered, segmented Bay Area housing market: Mortgage rates eased modestly, participation rose, and buyers returned. But inventory balance — not rates — was the dominant pricing force, especially across the Peninsula and core suburban markets.
Across the region, single-family homes under ~$3.3M remained seller-leaning, while condos and higher-priced segments favored buyers. This divergence in the SF bay area real estate trends persisted despite broader market activity reaching recent highs. PR Newswire
What This Means (High-Level Takeaway)
Rates stopped being the story in October.
Inventory mix and local employment stability determined outcomes.
The Bay Area did not move as one market:
Santa Clara accelerated
San Mateo split
Alameda stabilized
Contra Costa decelerated at the top
San Francisco lagged
Peninsula Market Snapshot — October 2025
City / Submarket | Median SFR Price | Median Condo Price | DOM | Months of Supply | Trend vs Sep | Market Lean |
Palo Alto | ~$3.49M | ~$1.0M-$1.5M | 17-32 | ~2.0-2.5 | Stable | Seller |
Redwood City | ~$1.85M | ~$800K-$1.2M | 15-25 | ~2.0 | Rising | Seller |
San Mateo | ~$2.7M–$2.9M | ~$950K–$1.4M | 28-32 | ~2.0–2.3 | Slight up | Seller |
Belmont | ~$2.3M–$2.5M | ~$900K–$1.2M | ~30+ | ~2.3 | Flat | Balanced |
Foster City | ~$2.2M | ~$700K–$1.1M | 30-35 | ~2.3 | Flat | Balanced |
San Carlos | ~$2.8M | ~$750K–$1.3M | 26-30 | ~2.0 | Stable | Seller |
Burlingame | ~$3.0M–$3.2M | ~$900K–$1.4M | 27-30 | 2.0-2.2 | Stable | Seller |
Redwood Shores | ~$2.5M–$2.7M | Data limited | 28-32 | ~2.1 | Stable | Seller |
Hillsborough | ~$4M+ | N/A | ~30+ | ~2.0–2.5 | Flat | Luxury soft |
Macro Context (Bay Area)
Mortgage rates dropped modestly in October, averaging ~6.1% for a 30-yr fixed loan. Lower rates improved affordability marginally but did not trigger broad bidding wars.
Inventory dominated pricing trends: Markets with constrained supply maintained pricing strength; oversupplied segments softened.
California home sales rose in October 2025 to their highest level since February 2025 — indicating renewed overall activity. PR Newswire
Sales cancellation rates ticked upward — ~5% of pending Bay Area contracts fell through in October, signaling buyer caution in some price bands. San Francisco Chronicle
County Divergence — October 2025
County | SFR Price Trend | Condo Trend | Inventory Trend | Market Lean |
San Mateo | SFR strong (2.0 MOS) | Condos soft (elevated DOM) | Inventory rising modestly | Split |
Santa Clara | Strong absorption, low DOM | Condos softer but stable | Balanced flow | Seller-lean (SFR) |
Alameda | Stable SFR pricing | Neutral condos/townhomes | Balanced | Neutral |
Contra Costa | Entry SFR holding | Townhomes buyer-lean | Upper tier softening | Neutral → Buyer |
San Francisco | SFR niche strength | Condos buyer-lean | Tight overall | Mixed |
Key Housing Metrics (Oct 2025 vs Sep 2025)
Metric | Sep 2025 | Oct 2025 | Trend |
Median SFR Price | $1.822M | $1.83M | ⬆ (+0.4%) |
SFR DOM | 27 days | 28 days | ⬆ |
Median Condo Price | $889K | $892K | ⬆ |
Condo DOM | 46 days | 48 days | ⬆ |
SFR MOS | 1.9 | 2.0 | ⬆ |
Condo MOS | 3.5 | 3.6 | ⬆ |
These metrics reinforce stability in SFR pricing and continued softness in condo absorption.
Economic Update (Sep → Oct 2025)
Indicator | Sep 2025 | Oct 2025 | Direction |
Federal Funds Rate | 4.75% | 4.75% (no October meeting change) | ➡️ (steady) |
30-yr Mortgage Rate (Freddie Mac PMMS avg) | 6.27% | ~6.10% | ⬇ |
10-yr Treasury Yield | 4.19% | ~4.12% | ⬇ |
CPI (YoY) | 2.9% | ~2.8% | ⬇ (continued easing) |
S&P 500 Monthly Change | +3.5% | +1.8% | ⬆ (modest rally) |
NASDAQ-100 Monthly Change | +5.4% | +2.6% | ⬆ |
What It Means (Peninsula Focus)
Buyers
Leverage in condos and high-end SFR: Higher months of supply and slower condo sales mean stronger negotiation power — credits, price cuts, and terms matter.
Peninsula SFR competition persists: Even with softened rates, core Peninsula submarkets still see tight inventory and fast contracts.
Sellers
Best window remains early autumn: Peninsula single-family homes in robust price tiers are still drawing competitive responses.
Luxury requires strategy: Higher-end SFRs and ultra-luxury properties require targeted positioning and staging.
Investors
Selective entry points: Condos and townhomes with elevated DOM offer yield opportunities. SFR in constrained zones (Redwood City, San Carlos) remain price-resilient.
Table of Contents:
SF Bay Area Real Estate Price Trends
KPeterson.realty Proprietary Heat Maps
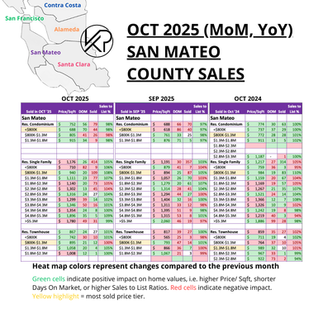
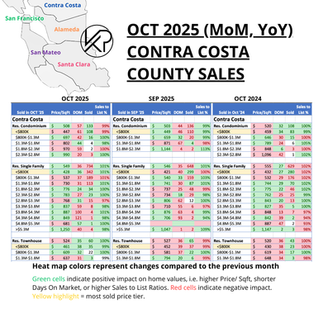
The charts below are month-over-month and year-over-year heat maps of pricing in the SF Bay Area. They are grouped by county and property type (Condo, Single Family Home, Townhouse). The metrics are Price per Square Foot, Days on Market, how many sold, and the List to Sales Price Ratio. We've now also included average square footage at each price level.
Green highlighted cells indicate items keeping prices up in comparison to previous month's metrics.
Red highlighted cells indicate the opposite, i.e downward pressure on sales price which favor buyers more.
Enlarge each county Heat Map by clicking on each of the images.


20-Year vs. 10-Year Appreciation
Bay Area single-family home prices have historically doubled every 10 years, thanks to a strong local economy and limited supply. Average sale price remained near the all-time high, showing continued strength.
As of this month...
Single family home appreciation over 10 years = 7.1% per year
Condo appreciation over 10 years = 3.3% per year


SF Bay Area Inventory Metrics
Active vs. Sold Listings
Active listings are homes currently on the market, while sold listings reflect homes that have successfully closed. When sold listings outpace active ones, it signals strong demand and favors sellers with faster sales and higher prices; when active listings outnumber sold ones, it suggests more supply and gives buyers more negotiating power and choice.


Active vs. Sold Listings – October 2025
Active vs Sold Listings Patterns:Where sold listings kept pace with new active listings (e.g., Peninsula SFRs under ~$3.3M), pricing held firm. Where active listings outpaced sales (luxury SFRs and many condo submarkets), pricing softened.
Months of Supply
The time it would take to sell all active listings at the current sales rate.
20-Year vs. 10-Year Months of Supply
This metric tells us how hot the markets are currently, i.e. the rate of change. If no new listings were added, this metric tells us how long it would take to sell all the remaining active homes. In the last 10 years, we have been in a Seller's Market except for condos in the year of 2020, when the COVID Pandemic hit.
Buyer's Market = Over 6 months of supply
Seller's Market = Under 3 months of supply


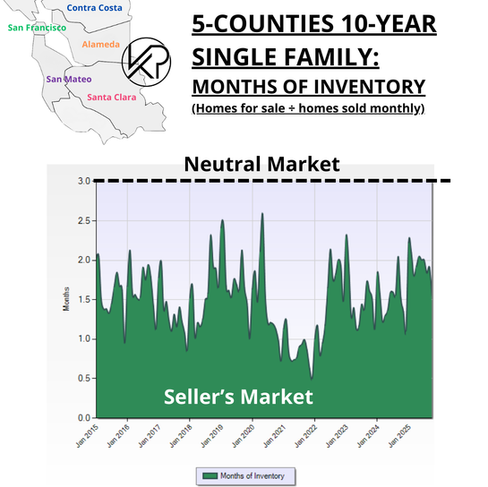


Single-Family Homes – Months of Inventory (SF Bay Area, October 2025)
In October 2025, SF Bay Area single-family home months of inventory remained near ~2.0, well below neutral levels, confirming a continued seller-leaning market despite rising seasonal listings.
Month-over-month change: Inventory increased slightly from September 2025, but homes for sale were largely offset by homes sold, preventing inventory buildup.
Year-over-year change: Inventory is higher than October 2024 but still materially below the long-term neutral benchmark of ~3.0 months, supporting price stability.
Impact on buyers, sellers, and investors: Sellers retained pricing power in core SFR price tiers; buyers faced competitive conditions under ~$3.3M; investors saw limited discounting due to constrained supply.
Condominiums – Months of Inventory (SF Bay Area, October 2025)
In October 2025, SF Bay Area condominium months of inventory remained elevated at approximately ~3.5–4.0, signaling a buyer-leaning condo market.
Month-over-month change: Inventory remained flat to slightly higher as active condo listings continued to exceed monthly sales.
Year-over-year change: Condo inventory levels are significantly higher than October 2024 and above pre-pandemic averages, reflecting a sustained supply shift.
Impact on buyers, sellers, and investors: Buyers gained leverage to negotiate price reductions and credits; sellers experienced longer days on market; investors found improved entry opportunities in oversupplied condo segments.
Demand Indicators
% Over Asking vs. DOM (12-Month Look Back)
The SF Bay Area housing market shows a clear inverse relationship between Days on Market (DOM) and Sale-to-List Price Ratios:as DOM decreases, homes sell further above list; as DOM increases, pricing power weakens.
This relationship holds consistently across both single-family homes and condominiums, validating that pricing outcomes are driven by absorption speed—not sentiment or headline rates.


What This Means in the Real World (October → November 2025)
For Sellers
Who should sell now:
Single-family home owners under ~$3.3M, especially move-up sellers and family homes near schools.
Why the data supports selling now:
Homes are still selling in ~28–30 days and closing at 4–5% above list, which tells us buyers are absorbing inventory quickly.
Months of inventory for single-family homes is still ~2.0, well below neutral.
As we move into November, seasonality works against sellers—fewer buyers, shorter days, more competition from listings that didn’t sell.
My opinion:If you’re a seller in a strong SFR segment, October–early November is your last clean window before leverage naturally softens into the holidays. Waiting for “lower rates” is risky when inventory—not rates—is what’s protecting prices today.
For Buyers
Who should buy now:
Condo buyers
Luxury buyers
Move-up buyers who already own a home
Why the data supports buying now:
Condos are taking 45–55 days to sell and closing at or below list price.
Higher inventory (3.5–4.0 months) means time is on the buyer’s side.
Sellers are more open to price cuts, credits, and rate buydowns, especially as November approaches.
My opinion:If you’re a buyer who doesn’t need to compete—this is your moment. You’re not buying into hype; you’re buying into slower absorption and motivated sellers. That’s when good deals actually happen.
For Investors
Who should act now:
Investors targeting condos, townhomes, or higher-priced assets
Long-term holders focused on entry price, not short-term appreciation
Why the data supports selective investing:
Elevated DOM + flat sale-to-list ratios signal pricing inefficiency, which creates entry opportunities.
Lower rates help the math, but the real edge is supply exceeding demand in specific segments.
Single-family homes remain expensive to buy into because inventory is still tight.
My opinion:This is not a “buy everything” market. It’s a pick-your-spot market. Investors win by leaning into segments where homes sit longer and sellers feel time pressure—not where inventory is still constrained.
Pending Sales
Homes under contract, i.e. Pending, show how quickly the market is moving.
The graphics below display the pending sales for all five counties, categorized by home types and price levels. The price tiers with the highest volume of pending sales for each home type and county are highlighted in yellow. For example, in San Mateo County, the most condos are sold at prices below $800K, while the most single-family homes and townhouses are sold between $800K and $1.3M. The color coding or heat map indicates changes compared to the previous month, with positive impacts on sales prices highlighted in green and negative impacts highlighted in red.

✅ Green (Seller-Favorable) Patterns
In October 2025, $1.3M–$1.8M single-family homes represent the only price tier with synchronized strength across all five Bay Area counties, making it the most resilient and competitive segment in the market.
This price band is the true Bay Area overlap zone where:
Buyers still exist in volume
Financing remains achievable
Inventory is absorbed quickly
Sellers retain pricing power without overreaching
🟥 Red (Buyer-Leverage) Zones
As of October 2025, luxury single-family homes ($3.8M+), high-end condos ($1.3M+), and high-priced townhomes ($1.3M+) are the only price tiers that are consistently red across all five Bay Area counties, reflecting excess supply and buyer leverage.
Single-Family Homes (SFR)
Demand thins sharply above $3.8M across every county. Buyers have alternatives, patience, and leverage. This tier is clearing through price discovery, not competition.
Condominiums (Condos)
$1.3M+ condos are a structural oversupply tier, not a seasonal slowdown. Even with lower rates, buyers are not absorbing inventory fast enough to support pricing.
Townhouses
Townhomes above $1.3M are getting squeezed from both sides:
Buyers stretch into SFRs instead
Condo buyers stay price-sensitive
Macroeconomics
Mortgage Rates
Mortgage rates declined for the second straight month in October, with the 30-year fixed rate averaging around 6.1%, down from roughly 6.3% in September, improving affordability at the margin.
Lower rates increased buyer activity but did not trigger bidding wars, as higher inventory in condos and luxury homes absorbed the added demand.
October’s rate drop brought more buyers back into the market, but pricing outcomes continued to be driven by inventory and absorption—not interest rates alone.


10-Year Treasury
Average yield in October 2025: ~4.10%–4.15%, largely flat to slightly lower than September, confirming stabilization after the summer peak near 4.4%.
Fed policy expectations remained the primary driver, with markets reinforcing expectations for additional easing into early 2026, keeping downward pressure on long-term yields.
Fiscal and structural constraints continued to cap declines, including elevated federal deficits, ongoing Treasury issuance, and a persistent term premium demanded by investors.
Cooling inflation and softer growth data supported yields staying lower, but not enough to push the 10-year Treasury decisively below the 4.0%–4.1% floor.
Why this matters:In October 2025, the 10-year Treasury confirmed a new, lower trading range rather than a breakout, explaining why mortgage rates eased modestly—but did not fall sharply—heading into Q4.
Stock Market
Tech indices continued positive growth in October, with NASDAQ and S&P 500 up modestly, supporting RSU and ESPP wealth effects for tech executives — especially relevant for Peninsula buyers with stock compensation exposure.
Bay Area venture capital in October remained focused on AI and enterprise tech funding, reinforcing local job stability and housing demand in core innovation hubs.
NASDAQ Composite (Tech-Heavy Index)
October 2025: +2.6% — gains continued, led by AI infrastructure, semiconductors, and cloud software, though momentum moderated after September’s surge.
September 2025: +5.4% — sharp rebound following the Fed’s 25 bps rate cut and strong AI earnings.
Year-over-Year (Oct ’24 → Oct ’25): ~+30%, maintaining its position as the top-performing major index.
October drivers:Stable interest rates, easing inflation expectations, and continued capital rotation into profitable large-cap tech rather than speculative growth.
S&P 500
October 2025: +1.8% — steady, broad-based gains as falling bond yields supported equity valuations.
September 2025: +3.5% — strong rally fueled by cooling CPI and declining Treasury yields.
Year-over-Year: ~+20%, with leadership from technology, healthcare, and consumer discretionary sectors.
October drivers:Lower volatility, resilient earnings, and confirmation that the Fed’s easing path would be gradual rather than aggressive.
Dow Jones Industrial Average
October 2025: ~+0.9% — modest gains as industrials and financials benefited from lower rates but lagged tech.
September 2025: +1.9% — improved performance following the Fed cut.
Year-over-Year: ~+9–10%, trailing growth-oriented indexes.
October drivers:Stabilizing manufacturing data and easing borrowing costs, offset by slower global growth expectations.
Bay Area Tech & Housing Impact
Continued gains in the NASDAQ and S&P 500 supported RSUs, stock options, and ESPPs for Bay Area tech employees, reinforcing consumer confidence.
Wealth effects were most pronounced among mid- to senior-level individual contributors and managers, improving down-payment capacity and move-up buyer activity.
Luxury housing demand saw limited lift, as gains were driven more by steady compensation growth than large liquidity events or IPO windfalls.
FED (Federal Reserve)
The Fed’s September rate cut confirmed modest easing; further cuts remain possible if inflation and job growth soften further.
Inflation
In October 2025, U.S. inflation eased modestly, led by slower shelter cost growth, but core inflation remained elevated enough to restrain aggressive Fed rate cuts—keeping mortgage rates lower, but not sharply lower.
Headline CPI (October YoY): ~2.8%, down from ~2.9% in September, confirming a continued but gradual disinflation trend.
Core CPI (excludes food & energy): ~2.9% YoY, easing from just above 3.0% in September, signaling slower underlying price pressures.
Month-over-month (October): Headline CPI rose ~0.2%, while Core CPI increased ~0.2%, consistent with cooling but still positive inflation momentum.
Key driver: Shelter inflation continued to slow, with owners’ equivalent rent showing smaller monthly gains than earlier in 2025, though housing costs remain the largest contributor to overall inflation.
Takeaway: By October 2025, inflation was cooling but not fully neutralized. While progress toward price stability supports lower interest rates over time, core inflation near 3% keeps the Federal Reserve cautious, limiting how quickly mortgage rates can fall.
Employment
Unemployment edged slightly higher (~4.4%), reflecting gradual labor market cooling without signaling recession — a mixed signal for housing demand.
Working in the SF Bay Area
In October 2025, most U.S. companies continue to require some in-office work, with hybrid schedules dominant and 3+ days in the office the most common expectation. Globally, roughly 70% of employers have formal in-office requirements, and 3 days per week is the leading hybrid standard. Fully remote arrangements remain rare, with fewer than 10% of companies allowing fully remote roles. FounderReports
Hybrid work dominates 2025: Most workers are not fully remote but work in the office part-time.
RTO Requirements rise: 3-day in-office schedules are now common, and fewer companies allow full remote work than in prior years. Archie
Year-over-year shift: Hybrid and RTO policies have strengthened compared to early 2025 and 2024, even as full-time remote work remains uncommon.
Regional Transit Trends
Transit usage (e.g., BART ridership) showed continued recovery, but hybrid work means many commutes still occur by car, impacting weekday downtown demand.
Office Space & leasing dynamics
Office leasing trends reflect positive absorption in core markets, especially for smaller, hybrid-oriented spaces — a trend that keeps Peninsula proximity attractive for those valuing flexible work models.
Positive office absorption returned: San Francisco office space posted positive net absorption (~300k+ sq ft) in Q3/October 2025, one of the first gains since 2019, even as overall vacancy remains elevated (~33–34%).
Sublease vacancy continued to shrink: Available sublease space decreased for the fifth straight quarter, driven by tech and AI firms taking discounted, high-quality space on shorter terms.
Smaller hybrid leases dominate: Roughly 75% of new leases were under 10,000 sq ft, reflecting hybrid work patterns that favor collaboration hubs over large traditional footprints.
Tech demand still central: AI and growth-oriented tech companies are leading leasing momentum, helping stabilize office market metrics.
Hybrid work reshapes space needs: Employers want quality space for collaboration, but not 5-day/week occupancy, supporting targeted office utilization rather than full downtown revival.
Startups and Venture Capital
In October 2025, venture capital continued flowing heavily into AI and enterprise tech startups, with multiple billion-dollar rounds and strong Bay Area participation, highlighting sustained investor confidence in AI infrastructure, automation, and commercial applications.
Global and U.S. VC momentum continued in October, with ~39 billion+ invested in early- and late-stage startups, driven by large AI and infrastructure rounds that kept capital flowing into innovation sectors. Crunchbase News
AI startups remained dominant, with multiple companies raising nine figures or more, including major AI infrastructure funding such as Reflection.ai’s billion-plus rounds backed by NVIDIA and leading VCs.
AI accounted for a large share of investment activity across seed, Series A, and growth rounds, with U.S. cities like San Francisco and New York capturing a significant portion of deals and demonstrating broad sector interest beyond Silicon Valley’s core. Eqvista
Venture data shows a shift toward larger, fewer deals with pre-seed/seed share declining, reflecting VC focus on companies with traction and stronger capital commitment. CDP Center
To subscribe:


Comments