
June 2025: Real Estate Trends in the SF Bay Area from San Mateo's Top Realtors
- Kevin Peterson
- Jul 19, 2025
- 14 min read

Updated: Aug 10, 2025
Who is KPeterson.realty and how can we help you?
The Data-Driven Realtor: With 40+ years of combined experience in global sales and management consulting, we offer advanced analytics and a unique scattergram analysis to provide unparalleled insights into your home's value and the local market. Each decision is supported by data, ensuring accuracy and confidence in your real estate journey.
Renovation Guidance: Planning renovations? We offer expert guidance on enhancements to optimize your return on investment. Our clients can also benefit from our reliable network of designers and contractors, with whom we have completed over 30 projects. Furthermore, we offer comprehensive project management for any home renovation project.
Exclusive Off-Market Opportunities: We go beyond the MLS by uncovering hidden gems. Each week, we personally connect with homeowners and leverage our network to find off-market properties tailored to your needs.
Financial Expertise: With 20+ years of experience in investing, lending, and tax strategies, we help clients navigate financing options, preserve wealth, and secure favorable terms.
Help us spread the word
Click HERE to discover how the SF Bay Area real estate markets have been evolving along side our local Silicon Valley as well as the U.S. and global economies.
And if you believe this monthly newsletter could be useful to someone you know, please pass along and let us know!
Executive Summary: Five SF Bay Area Counties Proprietary Market Analysis
June 2025 revealed a split market: single-family homes in San Mateo, Santa Clara, and Alameda continued to sell quickly and over asking, while high-end condos and homes above $3.5M softened due to rising inventory and slower demand. Mortgage rates dipped slightly to ~6.86%, but with the Fed holding rates steady and no cuts expected in 2025, affordability remains tight. Tech layoffs pushed Bay Area unemployment to 4.2%, yet AI-driven office leasing and nearly $2B in weekly VC funding signaled long-term strength. Buyers now have leverage in condos and luxury segments, while well-priced SFR sellers still hold the advantage.
Key Housing Metrics
SFRs averaging 105%–108% of list price, with DOM dropping to 19 days in hot segments.
Condos lagging, with 100.3% average sale-to-list and DOM rising to 43 days.
Months of Inventory:
SFRs: 2.0 (seller market)
Condos: 3.7 (neutral-to-buyer market)
Active vs. Sold Inventory: SFR supply rising seasonally but sales are keeping pace; condo listings outpace demand, signaling buyer leverage.
Economic & Labor Highlights
Mortgage rates eased to ~6.86%, but Fed remains firm: no cuts expected in 2025.
10-Year Treasury hovered at ~4.44%, sustaining high borrowing costs.
Inflation cooled modestly (Core CPI at 3.4%), but not enough to pivot Fed policy.
Bay Area unemployment rose to 4.2% due to tech layoffs—Intel, Scale AI, and Microsoft among major downsizers.
Wage growth slowed to 3.9% YoY, signaling softening but not stalling.
Commercial, Transit, & Work Trends
Office vacancy in SF dropped to 35.1%, the fastest improvement in a decade, thanks to AI firms like Harvey AI and OpenAI.
VC activity strong: Bay Area startups raised ~$1.8B in a single June week; OpenAI’s $40B raise still rippling across the market.
Hybrid work stabilizing at 3+ days in office; only 46% of workers use public transit regularly—car traffic is fully recovered.
What This Means for Buyers, Sellers, and Investors
For Buyers:
Mid-range SFRs still move fast—act quickly with a strong offer.
Condo and luxury home shoppers have room to negotiate, especially in SF and Santa Clara.
For Sellers:
Price strategically in the red-hot $1.3M–$2.8M range—underpricing still sparks bidding wars.
High-end condo sellers must lead with pricing, staging, and incentives.
For Investors:
Entry-level condos (<$800K) in Alameda and Contra Costa offer attractive buy-hold or flip opportunities.
Watch for deep value in slow SFR tiers in Contra Costa and SF.
AI commercial leasing suggests strong long-term demand for mixed-use and proximity-based residential assets.
Table of Contents:
SF Bay Area Real Estate Price Trends
KPeterson.realty Proprietary Heat Maps
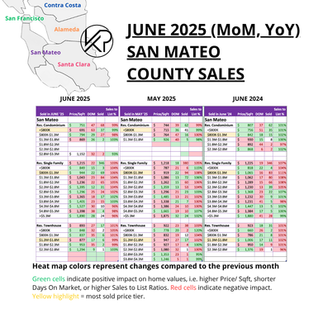
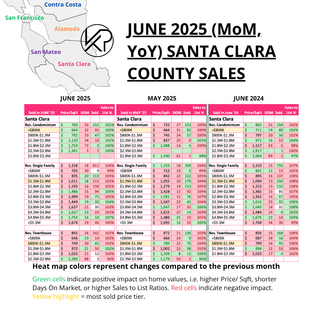
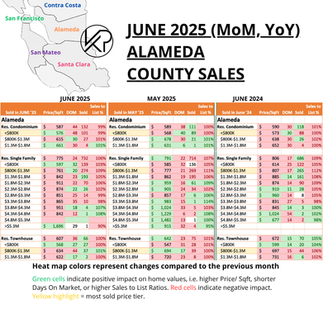
The charts below are month-over-month and year-over-year heat maps of pricing in the SF Bay Area. They are grouped by county and property type (Condo, Single Family Home, Townhouse). The metrics are Price per Square Foot, Days on Market, how many sold, and the List to Sales Price Ratio. We've now also included average square footage at each price level.
Green highlighted cells indicate items keeping prices up in comparison to previous month's metrics.
Red highlighted cells indicate the opposite, i.e downward pressure on sales price which favor buyers more.
Enlarge each county Heat Map by clicking on each of the images.


SF Bay Area Real Estate Market Matrix - June 2025
County | Property Type | Market Type | Best Price Points for Sellers | Best Price Points for Buyers |
San Mateo | Condos | ⚖️ Neutral | $800K–$1.3M (102% list-to-sale, DOM compressing) | <$800K (PPSF rising, but DOM still long) |
SFR | ✅ Strong Seller | $1.3M–$3.5M (105–109% list-to-sale, DOM 14–23 days) | <$800K (DOM = 87+, slowest-moving segment) | |
Townhomes | ✅ Seller | $800K–$2M (DOM < 24 days, strong absorption) | N/A | |
Santa Clara | Condos | 🛑 Buyer-Leaning | N/A | $1.3M+ (DOM 56–72 days, price softening) |
SFR | ✅ Strong Seller | $1.3M–$3.8M (High volume, 105–108% list-to-sale, low DOM) | <$800K (DOM = 99 days, lower PPSF) | |
Townhomes | ✅ Seller | $1.3M–$1.8M (DOM = 27–29, 105% list-to-sale) | <$800K (DOM = 130+, declining price trend) | |
Alameda | Condos | ⚖️ Neutral | <$800K (DOM = 39, 107–108% list-to-sale) | $800K–$1.3M (DOM elevated, flat YoY) |
SFR | ✅ Seller | $1.3M–$2.8M (DOM = 23–30, strong over-asking sales) | $800K–$1.3M (DOM = 267+, weak YoY PPSF growth) | |
Townhomes | ⚖️ Neutral | $800K–$1.3M (DOM = 43, 102% list-to-sale) | <$800K (DOM = 72+, slower sales velocity) | |
Contra Costa | Condos | ✅ Seller | <$800K–$1.3M (DOM = 29–34, 101–103% list-to-sale) | $1.3M+ (DOM rises, fewer sales, weaker pricing) |
SFR | ✅ Strong Seller | <$800K–$1.3M (DOM = 27–31, volume surge, 105–108%) | $2.8M+ (DOM increases, list-to-sale down to 96–99%) | |
Townhomes | 🛑 Buyer | N/A | All price points showing elevated DOM and low absorption | |
San Francisco | Condos | 🛑 Buyer | N/A | <$800K & $1.3M–$2M (DOM = 48–54, list-to-sale down, buyers negotiating) |
SFR | ⚖️ Mixed | $2.8M–$4.8M (DOM = 15–22, 107–109% list-to-sale) | <$1M (DOM = 116+, lowest PPSF and buyer hesitation) | |
Townhomes | ⚖️ Neutral | <$800K (DOM = 26, 103% list-to-sale) | $800K–$1.3M (DOM = 30+, price softening MoM) |
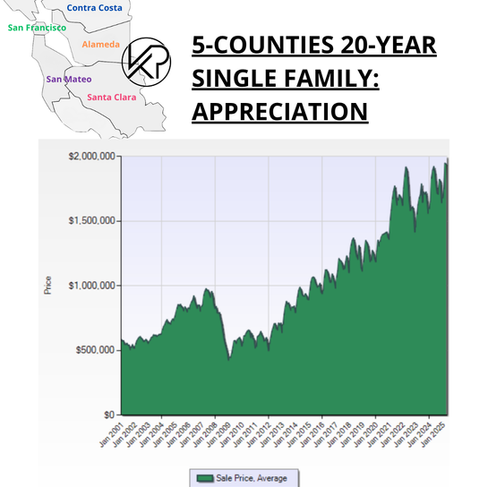
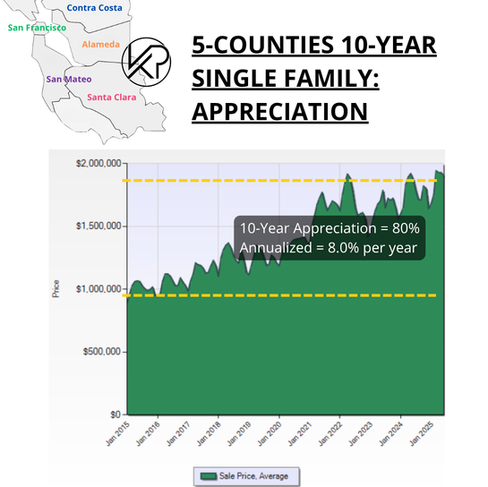
20-Year vs. 10-Year Appreciation
Bay Area single-family home prices have historically doubled every 10 years, thanks to a strong local economy and limited supply. Average sale price remained near the all-time high, showing continued strength.
As of this month...
Single family home appreciation over 10 years = 8.0% per year
Condo appreciation over 10 years = 3.5% per year


SF Bay Area Inventory Metrics
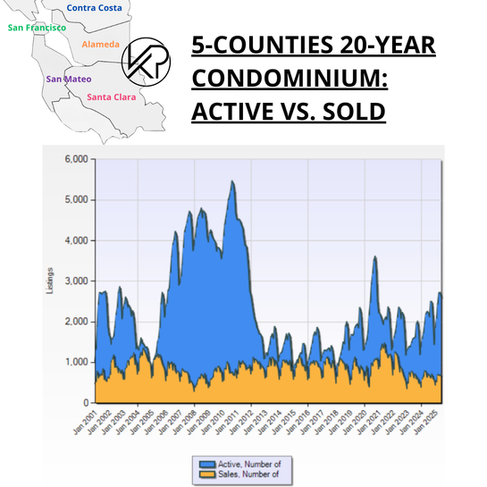
Active vs. Sold Listings
Active listings are homes currently on the market, while sold listings reflect homes that have successfully closed. When sold listings outpace active ones, it signals strong demand and favors sellers with faster sales and higher prices; when active listings outnumber sold ones, it suggests more supply and gives buyers more negotiating power and choice.


Single-Family Homes – June 2025
Month-over-Month (MoM):
Active listings rose modestly from May, driven by seasonal inventory increases.
Sold listings remained steady, especially in the $1.3M–$2.8M range where buyer activity is strong.
Year-over-Year (YoY):
Active inventory is up slightly YoY, but sold listings have also increased, keeping the market relatively balanced.
Demand continues to concentrate in core school zones and move-up price points.
Compared to Historic Norms:
Active inventory remains well below post-2008 levels and historically tight compared to pre-pandemic years.
Market still favors sellers, though cooling pressure is growing in the $3.5M+ range.
Condominiums – June 2025
Month-over-Month (MoM):
Active condo listings increased again in June, outpacing sales volume across all counties.
Sold listings remained flat or declined, especially in higher price brackets.
Year-over-Year (YoY):
Active condo inventory is up significantly YoY, especially in San Francisco, Santa Clara, and San Mateo.
Pending and sold activity has softened, especially in condos >$1.3M.
Compared to Historic Norms:
Current inventory levels mirror early 2020, with signs of growing oversupply in urban and luxury segments.
This tilts the balance toward buyers, especially for patient or cash-positioned purchasers.
Final Takeaway:
Segment | June 2025 Status | Trend vs May | Long-Term Comparison |
Single-Family Homes | Inventory up slightly, sales strong | ⚠️ Slight softening | ✅ Still tight vs post-2008, soft above $3.5M |
Condominiums | Listings rising, sales stalling | 📉 Buyer leverage | ⚠️ Resembles early 2020, oversupply returning |
Months of Supply
The time it would take to sell all active listings at the current sales rate.
20-Year vs. 10-Year Months of Supply
This metric tells us how hot the markets are currently, i.e. the rate of change. If no new listings were added, this metric tells us how long it would take to sell all the remaining active homes. In the last 10 years, we have been in a Seller's Market except for condos in the year of 2020, when the COVID Pandemic hit.
Buyer's Market = Over 6 months of supply
Seller's Market = Under 3 months of supply


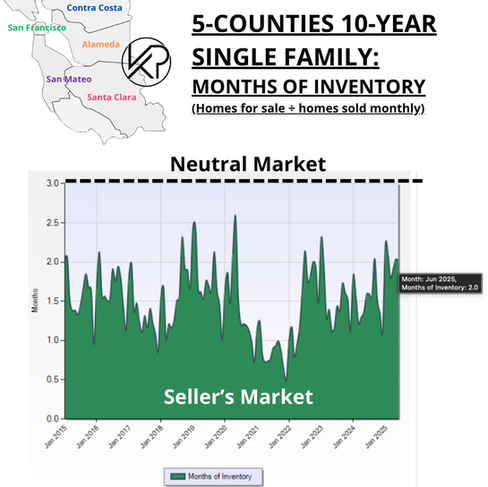


🏡 Single-Family Homes – June 2025
June 2025: 2.0 months of inventory → just on the edge of a seller’s market.
May 2025: ~1.9 months
YoY: Inventory remains below 2022–2023 peaks but continues to rise seasonally.
🏢 Condominiums – June 2025
June 2025: 3.7 months → firmly in neutral-to-buyer territory.
May 2025: 3.5 months
YoY: Highest since 2020 in some counties. Supply is pressuring price.
Quick summary
Segment | Buyer Advantage? | Seller Advantage? | Advice |
SFR | ❌ Low | ✅ High | Buyers: act fast; Sellers: list now |
Condos | ✅ Moderate | ⚠️ Weakening | Buyers: negotiate; Sellers: sharpen pricing & marketing |
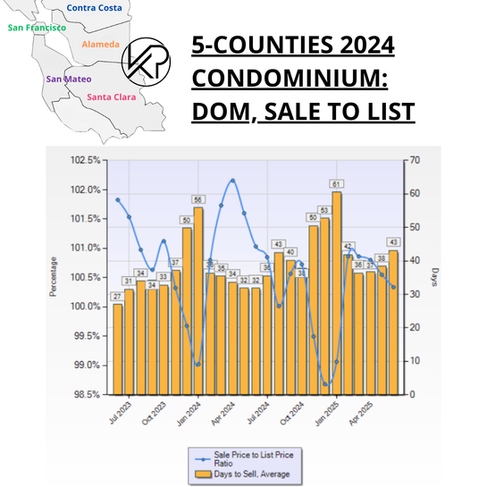
Demand Indicators
% Over Asking vs. DOM (12-Month Look Back)
How much over asking a home sold for and how fast it was sold, i.e. Days On Market are the next two Key Performance Indicators (KPIs) for our SF bay area real estate trends. These show how much demand there is for SF Bay Area single family homes and condos.
Days On Market measures how long it takes for homes to sell.
Buyers: Longer DOM gives more room for negotiation.
Sellers: Shorter DOM indicates strong interest.


🏡 Single-Family Homes – June 2025
Homes are still selling 6–8% over asking on average, especially in the $1.3M–$2.8M sweet spot.
Days on market improved slightly (21 → 19), reflecting buyer urgency for well-priced homes in competitive school districts.
🏢 Condominiums – June 2025
Sale-to-list ratio edged down again (100.8% → 100.3%), with more room for negotiation—especially in condos over $1.8M.
Days on market remains high (38 → 43), as affordability concerns and high inventory slow down buyer activity in urban and luxury condo segments.
Pending Sales
Homes under contract, i.e. Pending, show how quickly the market is moving.
The graphics below display the pending sales for all five counties, categorized by home types and price levels. The price tiers with the highest volume of pending sales for each home type and county are highlighted in yellow. For example, in San Mateo County, the most condos are sold at prices below $800K, while the most single-family homes and townhouses are sold between $800K and $1.3M. The color coding or heat map indicates changes compared to the previous month, with positive impacts on sales prices highlighted in green and negative impacts highlighted in red.

June Was a Seller’s Market—If You Hit the Right Price. Here's what stood out across the Bay Area:
✅ Green (Seller-Favorable) Patterns
$1.3M–$2.8M Single-Family Homes are the golden ticket again—low DOM, high $/sqft, and strong pendings in San Mateo, Santa Clara, and Contra Costa.
Entry-level condos (<$800K) in Alameda and Contra Costa continue to move, driven by affordability-seeking first-time buyers.
Townhouses $800K–$1.3M in San Mateo and Alameda show strong absorption and low DOM. These are functioning as “starter SFRs” for many buyers.
🟥 Red (Buyer-Leverage) Zones
Condos >$1.3M are weakening across San Mateo, Santa Clara, and San Francisco—especially in the $2.3M–$3.3M range. DOM over 45+ days, and pendings are flat or nonexistent.
High-end townhouses ($2M+) in SF and Santa Clara are showing signs of stress—slower absorption and softening $/sqft.
Contra Costa SFRs >$2.8M are lagging—weak PPSF and very few new contracts.
🟨 Most Popular Price Points (Yellow Highlights)
County | Property Type | Hottest Price Tier |
San Mateo | SFR | $2.3M–$2.8M |
Alameda | SFR | $1.3M–$1.8M |
Contra Costa | SFR | $800K–$1.3M |
Santa Clara | SFR | $1.3M–$1.8M |
San Francisco | Condo | $800K–$1.3M |
For Buyers
Luxury condos over $1.8M in SF, San Mateo, and Santa Clara are prime for negotiation—DOM > 45, very few pendings, declining $/sqft.
Townhomes in SF and Santa Clara at higher price points show buyer leverage—sellers may be willing to cut prices or offer incentives.
Contra Costa luxury SFRs are stagnant—deep value or long-hold potential only.
Best Entry Points:
Condos <$800K in Alameda and Contra Costa—still affordable and relatively fast-moving.
SFRs $1.3M–$2.3M in San Mateo and Santa Clara—some submarkets offer lower DOM and motivated sellers.
For Sellers
SFRs from $1.3M–$2.8M are 🔥 HOT 🔥 across the board—especially:
San Mateo: 39 pendings in the $2.3M–$2.8M range.
Santa Clara: 103 pendings in the $1.8M–$2.3M band.
Alameda: Multiple tiers from $1.3M–$2.3M are moving fast.
Townhouses <$1.3M in San Mateo and Contra Costa are outperforming condos and may yield stronger offers.
💡 Tip: Price just under psychological thresholds—e.g., $2.99M vs. $3M.
⚠️ Where to Be Cautious
Condos >$1.8M are stalling—longer DOM, limited buyer pool, softening $/sqft.
San Francisco condos continue to test seller patience—strategic pricing is critical, especially for anything over $2M.
💼 For Investors
Rental/Flip Potential: Condos <$800K in Alameda & Contra Costa. Shorter DOM = high turnover potential for quick rehab/resale or short-term rental.
Fix-and-Flip Zones: SFRs $1.3M–$2.3M in San Mateo, Santa Clara, and Alameda offer resale strength.
Townhouses <$1.3M in San Mateo or Contra Costa are low-maintenance buy/hold options with solid owner-occupant demand.
⚠️ Avoid:
High-end condos & townhomes >$2M — weak exit values and limited demand.
Contra Costa SFRs >$2.3M — red across all indicators; low ROI risk.
Macroeconomics
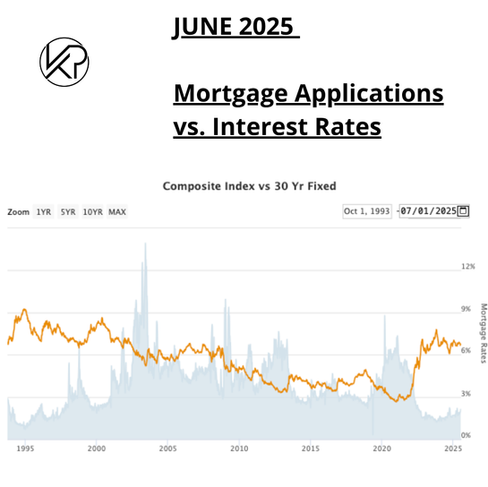
Mortgage Rates
📆 Month-over-Month (MoM)
Rates eased slightly in June, averaging around 6.86% for 30-year fixed.
Down from ~7.03% in May, offering modest relief to buyers in mid-June.
Applications ticked up modestly in response, especially in entry-level markets.
📉 Year-over-Year (YoY)
June 2024 rates were ~6.68%, so we’re still slightly higher YoY, though volatility has narrowed.
Compared to last year’s Q3 rate spike, the current trend feels more stable.
Refinance activity remains low, but purchase loans are steady in core price bands.
🕰️ Compared to Historic Norms
Rates remain well above the 3–4% range seen from 2011–2021, but are below long-term historical averages of ~7.5% from the 1990s–2000s.
This is a “new normal” range—high enough to challenge affordability, yet not recessionary.
Current rate levels are slowing appreciation but not collapsing demand in well-priced inventory.


10-Year Treasury
In June 2025, 10‑year Treasury yields remained elevated, averaging ~4.44%, after peaking at ~4.49% in early June.
This follows May’s sharp climb from 4.17% to 4.42%, driven by ongoing U.S. fiscal concerns, including deficit debates, persistent inflation in services, and global geopolitical tensions.
What to Watch For
Inflation reports (especially PCE and Core CPI): Any surprises will directly influence Treasury yields—and thus mortgage rates.
Fed tone & dot plot: If the Fed hints at tightening or delays cuts beyond 2026, yields may rise further.
Bond market sentiment: A major shift toward risk-off assets (e.g., Treasuries) could lower yields, easing borrowing costs.
Global macro pressure: Foreign demand for U.S. debt, geopolitical tensions, or credit rating shifts (e.g., Moody’s or Fitch warnings) may drive yield volatility.
Fiscal headlines: Large deficits, shutdown risk, or major Treasury auctions could trigger sharp, short-term moves in the 10-year.
Stock Market
NASDAQ (tech-heavy index) rose ~2.4% in June, driven by continued gains in AI, semiconductor, and cloud infrastructure stocks.
S&P 500 reached a new all-time high mid-June before pulling back slightly, finishing the month up ~1.8%.
Dow Jones Industrial Average lagged, gaining only ~0.6%, reflecting weakness in energy and traditional industrials.
Bay Area–tied tech giants like Apple, Nvidia, and Google all posted positive earnings revisions, fueling optimism and increasing stock-option-based homebuyer confidence.
Market sentiment remains cautiously bullish, but Fed rate policy and global trade uncertainties are keeping volatility elevated.
FED (Federal Reserve)
The Federal Reserve held interest rates steady at 5.25%–5.50% for the seventh straight meeting, citing sticky inflation and strong job data.
Fed Chair Jerome Powell reiterated that no cuts are expected until late 2025 or early 2026, emphasizing caution over premature easing.
Futures markets now price in zero cuts for 2025, a shift from prior expectations of one to two cuts earlier this year.
As a result, mortgage rates remain elevated, and buyers should plan accordingly—don’t expect major relief in borrowing costs soon.
What to Watch For in the Months Ahead
PCE inflation (especially core services): The Fed’s preferred metric—if it softens meaningfully, cut talk could resurface.
Job market softening – could push the Fed to act sooner.
10-year Treasury yield – a drop below 4.2% could lower mortgage rates.
Political/fiscal volatility – may disrupt bond and housing markets.
Inflation
Headline CPI for May (released in June) rose 3.2% year-over-year, holding steady from April.
Core CPI (excluding food and energy) cooled slightly to 3.4%, down from 3.6%, showing slow but meaningful disinflation in housing and durable goods.
Shelter costs, a major driver of inflation, finally began to flatten, helping ease pressure on the Fed.
Despite progress, inflation remains above the Fed’s 2% target, keeping policy restrictive.
What to Watch For
Rent and shelter trends – if they cool further, headline inflation could fall faster.
Core services inflation – sticky categories like insurance and healthcare remain elevated.
Energy prices – any summer spike could reverse recent gains.
Employment
The U.S. added 186,000 jobs in May, beating expectations and showing resilience in healthcare, education, and tech-adjacent sectors.
The unemployment rate ticked up slightly to 4.1%, hinting at softening but not signaling recession.
Wage growth moderated to 3.9% YoY, down from 4.3% in early spring—helpful for inflation but still strong enough to support housing demand.
SF Bay Area layoffs slowed, while AI and biotech firms continue hiring, especially in Santa Clara and San Mateo counties.
What to Watch For
Tech earnings + hiring plans – any hiring freezes or surprises could quickly shift buyer confidence.
Unemployment claims trend – sustained increases may signal broader weakness.
Wage growth – if it cools further, the Fed may ease pressure; if it rebounds, rates could stay high.
Bay Area job growth by sector – watch AI, clean tech, and health innovation for local real estate tailwinds.
🔻 June 2025 SF Bay Area Layoffs
The unemployment rate rose to 4.2%, driven by cuts in tech and professional services, while healthcare and government jobs saw modest gains.
Intel, Scale AI, and Microsoft led layoffs—Intel cut 107 roles in Santa Clara; Scale AI shed 200 full-time and 500 contract workers in SF.
Working in the SF Bay Area
Remote Work & RTO Mandates
Major employers in tech, finance, and retail (e.g., Amazon, JPMorgan, TikTok) have shifted from hybrid to strict RTO policies, requiring staff to work in-office most of the week. Business Insider
While many RTO mandates remain, flexible and coworking models continue to thrive—72% of firms plan to expand flex workspaces. Work Life News
Local government mirrored the trend: California’s state employee hybrid mandate was delayed until July 2026 after pushback from unions SEIU Local 1000.
Regional Transit Trends
BART ridership remains below its 2019 baseline despite month-to-month gains, highlighting a shift to remote work and auto dependence. bayareaeconomy.org
With ridership lagging, funding challenges for transit are growing—county and regional agencies are pushing new fare products (e.g., BayPass) and improvements to attract riders. bayareaeconomy.org
Office Space
Office vacancy in SF fell to ~35.1% in Q2, down from 35.8%—the fastest quarterly drop since 2015. Q2 net absorption hit 610 k sq ft (1.1 M in total since late 2024), fueled by AI and tech leasing (Coinbase, Databricks, Notion) SF Chronicle.
CBRE projects AI leasing could reach 2.7M sq ft/year by 2030, potentially halving vacant space and creating tens of thousands of jobs. CBRE
AI-related firms have leased more than 5 M sq ft over the past five years, with an additional 16M sq ft expected by 2030, marking a growing resurgence in downtown office markets.
Startups & VC Capital
Bay Area startups raised nearly $4 billion YTD in 2025, with $1.8 billion poured in during a single June week including notable Series A rounds: LanceDB ($30M) and Paraform ($20M)—alongside several AI and cybersecurity pre-seed deals Silicon Valley Tech Watch: Startup & Innovation News
According to Silicon Valley VC News Daily, Andreessen Horowitz led a $2 billion seed round for Thinking Machines Lab on June 26, signaling mega‑round confidence in foundational AI innovation.
Notable AI enterprise deals included:
Ciroos, a Bay Area–based AI SRE platform, raised $21 million seed round to hire engineers in SF Business Insider
Funding momentum carries over into cleantech, SaaS, and biotech, while entry-level hiring remains down ~50% since 2019, reflecting a cautious yet deep‑tech focused ecosystem polsky.uchicago.edu.
Why It Matters for Real Estate
High-growth companies expanding—especially AI-focused—are fueling office leasing and local hiring, energizing submarkets in South SF, Peninsula, and Berkeley.
Investor-backed payrolls mean upgraded housing demand, particularly in areas near innovation hubs and new office campuses.
Entry-level roles lag, indicating slower demand at the bottom end of the market, while senior and specialized talent clusters drive activity in premium segments.
To subscribe:


Comments