
May 2025: Real Estate Trends in the SF Bay Area from San Mateo's Top Realtors
- Kevin Peterson
- Jun 9, 2025
- 13 min read

Updated: Aug 10, 2025
Who is KPeterson.realty and how can we help you?
The Data-Driven Realtor: With 40+ years of combined experience in global sales and management consulting, we offer advanced analytics and a unique scattergram analysis to provide unparalleled insights into your home's value and the local market. Each decision is supported by data, ensuring accuracy and confidence in your real estate journey.
Renovation Guidance: Planning renovations? We offer expert guidance on enhancements to optimize your return on investment. Our clients can also benefit from our reliable network of designers and contractors, with whom we have completed over 30 projects. Furthermore, we offer comprehensive project management for any home renovation project.
Exclusive Off-Market Opportunities: We go beyond the MLS by uncovering hidden gems. Each week, we personally connect with homeowners and leverage our network to find off-market properties tailored to your needs.
Financial Expertise: With 20+ years of experience in investing, lending, and tax strategies, we help clients navigate financing options, preserve wealth, and secure favorable terms.
KPeterson.realty Complimentary Listing Services
Luxury staging | Cleaning | Inspection: All provided at no cost to you!
Renovation & ROI Management: Maximize value with in-house contractors and project management
Financial & Tax Strategies: Expert advice on finance, diversification & wealth preservation
Pre-Market Agent Engagement: Early exposure to maximize visibility
Targeted Campaigns: Door knocking & postcards to drive significant open house traffic
Buzz-Worthy Open Houses: Captivating events, 7 days a week
Follow-Ups: Personal outreach to all visitors & agents
Digital Marketing: Paid & organic advertising to reach more buyers
Scattergram Pricing Analysis: Proprietary, data-driven strategy
Help us spread the word
Click HERE to discover how the SF Bay Area real estate markets have been evolving along side our local Silicon Valley as well as the U.S. and global economies.
And if you believe this monthly newsletter could be useful to someone you know, please pass along and let us know!
Executive Summary: Five SF Bay Area Counties Proprietary Market Analysis
The Bay Area real estate market in May 2025 is showing clear signs of divergence between property types and price points. While single-family homes remain competitive, condos and townhomes are entering more neutral or buyer-leaning territory as inventory builds and days on market stretch. Mortgage rates hovering near 6.9% continue to pressure affordability, especially for first-time buyers and entry-level properties.
Despite higher inventory across all property types, median home prices largely held steady, especially for single-family homes in core markets like Santa Clara and San Mateo counties, which remain top-performing for sellers. Meanwhile, San Francisco’s market continues to soften, particularly in the condo sector, where both price and buyer urgency are slipping.
In this table, we summarize the price changes MoM (i.e. May versus April) and YoY (i.e. 2025 versus 2024).
County | Single-Family Homes | Condos |
San Mateo | Median Price: ~$1.92M MoM: ▼ 0.5% YoY: ▲ 5.6% | Median Price: ~$899,000 MoM: ▼ 0.7% YoY: ▲ 0.9% |
Santa Clara | Median Price: ~$1.88M MoM: ▲ 2.1% YoY: ▲ 4.2% | Median Price: ~$850,000 MoM: ▲ 0.6% YoY: ▲ 1.0% |
San Francisco | Median Price: ~$1.22M MoM: ▼ 2.4% YoY: ▼ 2.4% | Median Price: ~$965,000 MoM: ▼ 2.8% YoY: ▼ 5.1% |
Alameda | Median Price: ~$1.13M MoM: ▼ 1.7% YoY: ▲ 1.5% | Median Price: ~$685,000 MoM: ▼ 2.0% YoY: ▼ 1.4% |
Contra Costa | Median Price: ~$795,000 MoM: ▲ 1.3% YoY: ▲ 1.0% | Median Price: ~$660,000 MoM: ▲ 0.8% YoY: ▲ 0.7% |
What This Means for Buyers
Leverage is growing—especially in the condo and townhome segments across San Francisco, Santa Clara, and Contra Costa counties.
Single-family homes still sell fast and over asking in the $1.3M–$2.8M range—come prepared with clean offers and aggressive terms if shopping there.
If you're rate-sensitive, this is the time to negotiate pricing or seller credits, especially on properties with 30+ days on market.
What This Means for Sellers
Single-family sellers in hot zones (Santa Clara, San Mateo, Contra Costa counties) are still in control—but only with smart pricing and strong prep.
Overpriced condos or townhomes are sitting longer, especially above $1.3M—realistic pricing and standout presentation are essential.
If you're sitting on equity, now may be a good time to sell before inventory rises further or rates cool the market more.
What This Means for Investors
Condos and townhomes under $800K in Alameda and Contra Costa counties are ripe for value-add, rental conversion, or cashflow strategies.
The single-family home sweet spot ($1.3M–$2.8M) continues to offer fast resale velocity—great for well-timed flips.
SF multifamily and luxury condo product is entering bargain territory—opportunities for discount acquisitions are emerging if you're patient and liquid.
Table of Contents:
SF Bay Area Real Estate Price Trends
KPeterson.realty Proprietary Heat Maps
The charts below are month-over-month and year-over-year heat maps of pricing in the SF Bay Area. They are grouped by county and property type (Condo, Single Family Home, Townhouse). The metrics are Price per Square Foot, Days on Market, how many sold, and the List to Sales Price Ratio. We've now also included average square footage at each price level.
Green highlighted cells indicate items keeping prices up in comparison to previous month's metrics.
Red highlighted cells indicate the opposite, i.e downward pressure on sales price which favor buyers more.
Enlarge each county Heat Map by clicking on each of the images.


SF Bay Area Real Estate Market Matrix - May 2025
County | Property Type | Market Type | Best Price Points for Sellers | Best Price Points for Buyers |
San Mateo | Condos | ⚖️ Neutral | $800K–$1.3M (DOM ↓, List-to-Sale ~102%) | <$800K (PPSF rising but DOM still elevated) |
SFR | ✅ Strong Seller | $1.3M–$3.5M (PPSF up, DOM short, 105–108% list-to-sale) | <$800K (DOM = 81 days, slower-moving) | |
Townhomes | ✅ Strong Seller | $800K–$1.3M & $1.3M–$2M (DOM < 25 days, 104–106%) | N/A | |
Santa Clara | Condos | 🛑 Buyer-Leaning | N/A | $1.3M+ (DOM 70+ days, weaker list-to-sale) |
SFR | ✅ Strong Seller | $1.3M–$3.5M (High volume, DOM ↓, 105–107%) | <$800K (DOM 96, flat PPSF) | |
Townhomes | ✅ Seller | $1.3M–$1.8M (DOM = 28, 105% list-to-sale) | <$800K (DOM = 136, price softening) | |
Alameda | Condos | ⚖️ Neutral | <$800K (DOM = 40, 108% list-to-sale) | $800K–$1.3M (flat YoY, DOM elevated) |
SFR | ✅ Seller | $1.3M–$3.5M (DOM = 26–32 days, strong over-list sales) | $800K–$1.3M (DOM = 269, weak YoY price growth) | |
Townhomes | ⚖️ Neutral | $800K–$1.3M (DOM = 43, 102% list-to-sale) | <$800K (DOM = 75, slower moving) | |
Contra Costa | Condos | ✅ Seller | $800K–$1.3M (DOM = 30, 102% list-to-sale) | $1.3M+ (higher DOM, less volume) |
SFR | ✅ Strong Seller | <$800K (DOM = 29, PPSF +243% YoY volume increase) | $3M+ (DOM increases sharply, 96–99% list-to-sale) | |
Townhomes | 🛑 Buyer | N/A | All price points showing softness | |
San Francisco | Condos | 🛑 Buyer | N/A | <$800K & $1.3M–$2M (DOM 49–52 days, price softening) |
SFR | ⚖️ Mixed | $2.8M–$4.8M (DOM = 15–21, 107–109% list-to-sale) | <$1M (DOM = 113+, lowest PPSF) | |
Townhomes | ⚖️ Neutral | <$800K (DOM = 25, 103% list-to-sale) | $800K–$1.3M (DOM = 31, price softening MoM) |
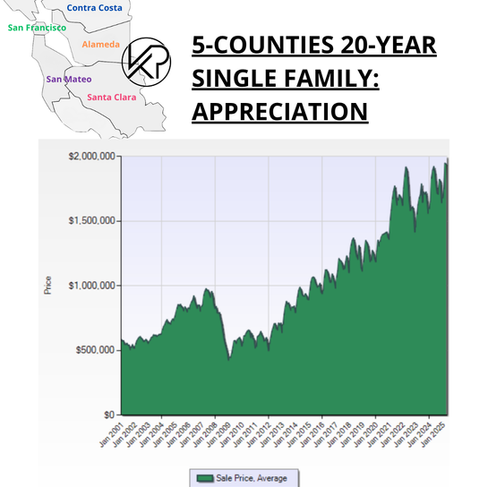
20-Year vs. 10-Year Appreciation
Bay Area single-family home prices have historically doubled every 10 years, thanks to a strong local economy and limited supply. Average sale price remained near the all-time high, showing continued strength.
As of this month...
Single family home appreciation over 10 years = 8.2% per year
Condo appreciation over 10 years = 4.0% per year


SF Bay Area Inventory Metrics
Active Listings
The overall number of homes available on the market. An increased inventory combined with a slower selling rate typically benefits buyers, whereas decreased inventory and a faster selling rate usually benefit sellers.


Single-Family Homes – May 2025
Active listings increased compared to April—reaching the highest point in over a year. Inventory growth in May signals early signs of a market shift—from ultra-competitive to more balanced.
Sales volume held steady, indicating demand is still absorbing inventory, but not fast enough to keep pace with the new supply.
Compared to Historical Norms:
Nowhere near the 2008–2011 glut, when actives drastically outpaced sales.
Sales are holding closer to 2021–2022 levels, but we’re trending upward in inventory like in mid-2018—a sign the market is loosening for buyers.
Condominiums – May 2025
Active listings surged to one of the highest levels in the past 5 years. April had fewer active listings and a slightly higher absorption rate.
Sales volume did not rise proportionately, widening the gap and putting pressure on sellers. The inventory-to-sales imbalance in May signals a cooling condo market, especially in urban centers.
Compared to Historical Norms:
We are now approaching 2020-2021 inventory levels, but with less buyer urgency.
The last time we saw this level of separation between condo listings and sales was early COVID—suggesting buyers are cautious, price-sensitive, or waiting for rate drops.
Final Takeaway:
Segment | May 2025 Status | Trend vs April | Long-Term Comparison |
Single family homes | Active listings rising, demand steady | Slight cooling | Still strong vs post-2008, but watch for softening |
Condos | Listings high, sales flat | Buyers gaining leverage | Resembles early 2020 dynamics—growing oversupply |
Months of Supply
The time it would take to sell all active listings at the current sales rate.
20-Year vs. 10-Year Months of Supply
This metric tells us how hot the markets are currently, i.e. the rate of change. If no new listings were added, this metric tells us how long it would take to sell all the remaining active homes. In the last 10 years, we have been in a Seller's Market except for condos in the year of 2020, when the COVID Pandemic hit.
Buyer's Market = Over 6 months of supply
Seller's Market = Under 3 months of supply


🏡 Single-Family Homes – May 2025
Seller's market conditions continue, but signs of softening as inventory builds modestly.
Slight increase (from 1.9 to 2.1 months), but still firmly in a seller’s market (below 3 months). Well-priced homes continue to sell quickly with competitive bidding in most areas.
Compared to prior years: Inventory is rising but remains historically low—nowhere near the neutral zone seen during the Great Recession or early 2020.
🏢 Condominiums – May 2025
Buyers have more options, and sellers need to be realistic and competitive on price.
Condos are firmly in a neutral market—leaning toward buyer’s market territory. Slower absorption and more listings are giving buyers more leverage.
Compared to prior years: This is the highest inventory level since early 2021, signaling a cooling trend in the condo sector across the Bay Area.
Quick summary
Segment | Buyer Advantage? | Seller Advantage? | Advice |
SFR | ❌ Low | ✅ High | Buyers: act fast; Sellers: list now |
Condos | ✅ Moderate | ⚠️ Weakening | Buyers: negotiate; Sellers: sharpen pricing & marketing |
Demand Indicators
% Over Asking vs. DOM (12-Month Look Back)
How much over asking a home sold for and how fast it was sold, i.e. Days On Market are the next two Key Performance Indicators (KPIs) for our SF bay area real estate trends. These show how much demand there is for SF Bay Area single family homes and condos.
Days On Market measures how long it takes for homes to sell.
Buyers: Longer DOM gives more room for negotiation.
Sellers: Shorter DOM indicates strong interest.


🏡 Single-Family Homes – May 2025
Homes are still selling 7–8% over asking on average, with strong competition in the $1.3M–$2.8M range.
Days on market ticked up slightly (19 → 21), but demand remains high—well-priced homes are moving fast.
🏢 Condominiums – May 2025
Sale-to-list ratio dipped slightly (~101% → 100.8%), showing buyers are negotiating more.
Days on market increased (36 → 38), signaling continued buyer hesitation in higher-priced urban condos.
Pending Sales
Homes under contract, i.e. Pending, show how quickly the market is moving.
The graphics below display the pending sales for all five counties, categorized by home types and price levels. The price tiers with the highest volume of pending sales for each home type and county are highlighted in yellow. For example, in San Mateo County, the most condos are sold at prices below $800K, while the most single-family homes and townhouses are sold between $800K and $1.3M. The color coding or heat map indicates changes compared to the previous month, with positive impacts on sales prices highlighted in green and negative impacts highlighted in red.

April was a tale of two markets: strong demand in affordable and mid-range homes, but continued weakness at the luxury end. Here’s what stood out across the Bay Area:
✅ Green (Seller-Favorable) Patterns:
Sellers in the $1.3M–$2.3M SFR segment are winning across nearly all counties—high PPSF, low DOM, and high pending count.
The under-$800K condo market in Alameda and Contra Costa remains active, likely due to affordability pressures.
Townhouses in the $800K–$1.3M range are hot in Contra Costa and San Mateo, showing strong buyer activity and shorter DOM.
🟥 Red (Buyer-Leverage) Zones:
The condo market over $1.3M is showing softness in San Mateo, Santa Clara, and San Francisco—low PPSF and longer DOM.
Several townhouse segments in Santa Clara and San Francisco are cooling, particularly at higher prices.
Contra Costa SFRs over $2.3M are struggling—long DOM, low PPSF, and minimal pending sales.
🟨 Most Popular Price Points (Yellow Highlights)
County | Property Type | Hottest Price Tier |
San Mateo | Single Family | $2.3M–$2.8M |
Alameda | Single Family | $1.3M–$1.8M |
Contra Costa | Single Family | $800K–$1.3M |
Santa Clara | Single Family | $1.3M–$1.8M |
San Francisco | Condo | $800K–$1.3M |
Key Takeaways
🏠 For Buyers
Condos over $1.3M in San Mateo, SF, and Santa Clara = weak demand, longer days on market (DOM), and red across most metrics. Translation: you can negotiate hard.
Townhomes in SF and Santa Clara = declining PPSF and fewer pendings. You may find price cuts or motivated sellers.
Luxury SFRs ($4.5M+) in Contra Costa or $3.8M+ in Santa Clara = slower sales; cash buyers may get discounts.
Best Opportunities:
Entry-level Condos <$800K in Alameda and Contra Costa are moving, but still relatively affordable.
In San Francisco, some SFRs between $1.3M–$2.3M offer good value with healthy inventory and softer DOM—especially westside neighborhoods.
🔑 For Sellers (Price Points with Strong Demand):
Single-family homes from $1.3M–$2.8M across all counties are RED HOT—especially in San Mateo (39 pending at $2.3M–$2.8M) and Santa Clara (103 pending at $1.8M–$2.3M).
Alameda County SFRs in the $1.3M–$1.8M range and townhouses <$1.3M in Contra Costa and San Mateo are also moving fast.
If you're in these price bands, you're in the driver’s seat—consider strategic pricing just under psychological thresholds ($2.99M vs. $3M).
⚠️ Where to Be Cautious:
Condos >$1.8M are soft across the board—more DOM, lower PPSF, and fewer buyers. Don’t expect multiple offers.
Price realistically in SF condo market, where buyers are pickier and inventory is piling up.
💼 For Investors
Rental/Flip Potential in Condos <$800K (Alameda & Contra Costa) with decent pending activity and short DOM. These are entry points into appreciating areas.
Fixers in SFR sweet spots: Buy below market in the $1.3M–$2.3M SFR range (San Mateo, Santa Clara, Alameda) where resale demand is highest.
Townhouses <$1.3M in San Mateo or Contra Costa offer attractive hold/rent plays with strong buyer interest and lower competition from institutional buyers.
⚠️ What to Avoid:
High-end condos and townhouses ($2M+)—they're sitting and bleeding value. Cap rates are weak, exit timelines long.
Anything in the $2.3M+ tier in Contra Costa—slow absorption and red across most metrics means your money can work harder elsewhere.
Macroeconomics
Mortgage Rates
Month-over-Month Change:
In May 2025, 30‑year fixed mortgage rates edged higher, bouncing between 6.76% and 6.89%, before settling around 6.85% by June 5. Early-month rates mirrored April levels, but climbed mid- and late-May to the highest since February—driven by rising Treasury yields, fiscal uncertainty following a Moody’s downgrade, and sticky inflation. Despite a minor dip in early June, rates remain elevated near the 7% mark.


10-Year Treasury (correlated to 30 year mortgages)
In May 2025, 10‑year Treasury yields climbed from ~4.17% at April’s end to average ~4.42%—a 24‑basis‑point increase triggered by U.S. fiscal strain (including a Moody’s downgrade) and lingering tariff anxiety.
By early June, yields peaked at ~4.49%.
Analysts at Goldman Sachs and others expect Treasury yields to stay near current levels (~4.4–4.5%) into year‑end, keeping mortgage rates elevated through 2025. BusinessInsider
Stock Market (Performance in May 2025)
In May 2025, U.S. stock markets smashed April’s volatility. The Dow climbed 3.9%, the S&P jumped 6.2%, and the Nasdaq outperformed with a 9.6% surge—its strongest month since November 2023.
The catalyst? Easing trade tensions and a massive rebound in tech—led by Nvidia’s ~24% surge—while retail investors pivoted from big names into smaller AI and quantum plays like Navitas, CoreWeave, D‑Wave, and Rigetti.
Institutional “Big Money” followed suit, boosting sentiment and nudging valuations up to ~22.7× forward earnings.
But caution flags are waving: retail exuberance often signals a top, and markets are trading on the assumption of continued earnings momentum.
FED (Federal Reserve)
In May 2025, the Federal Reserve kept interest rates locked at 4.25 %–4.50%, marking a fourth straight freeze.
The statement echoed caution over lingering inflation, tariff uncertainty, and a resilient labor market—even as GDP showed signs of strain.
Fed officials, including Governor Kugler, emphasized a need for flexibility: cuts remain on the table, but only if inflation cools and trade headwinds ease.
Market confidence in early rate cuts evaporated—now there's less than a 17% chance of moves in June or July, and officials are signaling a wait-and-see approach as balance sheet runoff continues and data dynamics play out.
What to Watch
Can tariffs finally cool inflation? Continued trade frictions could leave the Fed sidelined longer.
Labor market data in the next 2–3 months could tilt the Fed toward a cut—or keep rates steady.
Announcements around Fed balance-sheet unwind will be a subtle but important indicator of tone.
Inflation
Inflation ticked up in May—CPI rose to approximately 2.4–2.5% year-over-year, its first rise after easing for three consecutive months.
Core CPI, excluding food and energy, increased to 2.9%, a sign that goods inflation remains stubborn as tariff effects ripple through prices.
Month over month, CPI edged up 0.2%, with a measurable rise in core goods—essentially showing that tariff costs are being passed through.
Notably, the BLS had some data collection hiccups due to staff cuts, which may skew detailed breakdowns, but headline inflation remains reliable.
Employment
The U.S. labor market in May is stable—but quietly grinding. Job creation is weaker, federal cuts continue, and entry-level or new grads are getting squeezed. Possible recession warning lights are flickering.
U.S. Employment:
May’s U.S. jobs report painted a sobering portrait—139,000 new jobs added (beating calls, though below April’s 147k), while unemployment stuck at 4.2%.
Labor participation dipped as federal job cuts wiped out 22,000 roles in May (59k since January).
Growth remains concentrated in health care and hospitality, wage gains hold modest, but downward revisions and workforce softening suggest a labor landscape quietly losing strength.
Bay Area Employment:
Bay Area tech layoffs escalated in May, with more than 60,000 roles eliminated across 284 companies.
Heavyweights like Google, Microsoft, Intel, Meta, and LinkedIn led the charge—LinkedIn alone shedding 281 Bay Area employees.
Unlike April’s AI-driven trimming, May’s job cuts skewed toward cost rationalization amid broader industry belt-tightening.
May’s layoffs have cooled the Bay Area real estate market—but not shattered it. We’re seeing a “soft landing,” not a nosedive. Prices are recalibrating, inventories swelling, and buyer confidence taking a hit—but broad resiliency from non-tech sectors is holding things together.
Working in the SF Bay Area
Remote Work & RTO Mandates
Google doubled down in May by enforcing hybrid schedules—teams like technical services and HR must be in the office three days per week or they risk getting the boot, with relocation compensation offered within ~50 miles of an office .
Apple is phasing in-office mandates (one day/week in April, three days/week by May).
Uber: CEO Dara Khosrowshahi announced the shift from two to three office days weekly, tightened remote approvals and even rescinded sabbatical perks—citing the need for performance over perks. Employee backlash was real, internal “unprofessional” comments were rebuked, and office expansion plans of 700,000 sq ft are already underway .
Regional Trends
Bay Area commuters seem fine with the new routine: 63 % are doing part-time in-office by Feb 2025 (up from 44 % in late 2021). But transit use is still lagging: only 46 % ever use it, while car and bridge traffic has rebounded to pre‑COVID levels sfchronicle.
Office Space
Sublease Availability Decreases
AI leasing in SF is projected to hit around 2.7 million sq ft/year by 2030, reviving a market once hovering around 35 % vacancy. credaily
Vacancy Rates
Ticked up in Q1 to ~35–36 %, but there's hope: AI firms moving in could cut vacancy rates in half and create up to 60,000 jobs, per CBRE bizjournals
Startups & VC Capital
OpenAI’s massive $40 billion funding round from April continued to echo in May, anchoring further AI expansion and office leasing bizjournals
Exowatt, eco‑energy darling, locked down $70 million in Series A aimed at scalable renewable power for data centers—including AI powerhouses wikipedia
The SV startup ecosystem kept pumping:
16 Bay Area startups pulled in $1.345 billion in the week of May 12 edithyeung
However, entry-level hiring dropped—new graduate roles at the 15 largest tech firms fell over 50 % since 2019, signaling a continued white-collar recession sfstandard
To subscribe:


Comments