
July 2025: Real Estate Trends in the SF Bay Area from San Mateo's Top Realtors
- Kevin Peterson
- Aug 11, 2025
- 13 min read

Who is KPeterson.realty and how can we help you?
The Data-Driven Realtor: With 40+ years of combined experience in global sales and management consulting, we offer advanced analytics and a unique scattergram analysis to provide unparalleled insights into your home's value and the local market. Each decision is supported by data, ensuring accuracy and confidence in your real estate journey.
Renovation Guidance: Planning renovations? We offer expert guidance on enhancements to optimize your return on investment. Our clients can also benefit from our reliable network of designers and contractors, with whom we have completed over 30 projects. Furthermore, we offer comprehensive project management for any home renovation project.
Exclusive Off-Market Opportunities: We go beyond the MLS by uncovering hidden gems. Each week, we personally connect with homeowners and leverage our network to find off-market properties tailored to your needs.
Financial Expertise: With 20+ years of experience in investing, lending, and tax strategies, we help clients navigate financing options, preserve wealth, and secure favorable terms.
Help us spread the word
Click HERE to discover how the SF Bay Area real estate markets have been evolving along side our local Silicon Valley as well as the U.S. and global economies.
And if you believe this monthly newsletter could be useful to someone you know, please pass along and let us know!
Executive Summary: Five SF Bay Area Counties Proprietary Market Analysis
July 2025 brought a sharper divide in the market. The number of triple-green price tiers — price ranges identified in our proprietary heat maps where homes are selling faster, for more money per square foot, and with more buyers going into contract — was smaller this month. But in San Mateo, Alameda, Contra Costa, Santa Clara, and San Francisco counties, those hot segments still moved quickly and often over asking.
In contrast, high-end condos and single-family homes in slower “red-zone” tiers saw longer days on market and softer prices.
For now, buyers have the upper hand in most condo and luxury markets, while sellers in the most competitive single-family price bands (ie. SFRs) continue to call the shots.
Overall, the outlook remains positive as mortgage rates eased to ~6.57%, tech layoffs slowed, and surging AI-driven office leasing — paired with record-breaking venture funding — reinforced confidence in the Bay Area’s long-term economic strength.
Key Housing Metrics
SFRs averaging 105%–108% of list price, with DOM dropping to 19 days in hot segments.
Condos lagging, with 100.3% average sale-to-list and DOM rising to 43 days.
Months of Inventory:
SFRs: 2.0 (seller market)
Condos: 3.7 (neutral-to-buyer market)
Active vs. Sold Inventory: SFR supply rising seasonally but sales are keeping pace; condo listings outpace demand, signaling buyer leverage.
Economic and Labor Highlights
Mortgage rates eased to ~6.86%.
10-Year Treasury hovered at ~4.44%, sustaining high borrowing costs.
Inflation cooled modestly (Core CPI at 3.4%), but not enough to pivot Fed policy.
Commercial, Transit, and Work Trends
Office vacancy in SF dropped to 35.1%, the fastest improvement in a decade, thanks to AI firms like Harvey AI and OpenAI.
VC activity strong: Bay Area startups raised ~$1.8B in a single June week; OpenAI’s $40B raise still rippling across the market.
Hybrid work stabilizing at 3+ days in office; only 46% of workers use public transit regularly—car traffic is fully recovered.
What This Means for Buyers, Sellers, and Investors
For Buyers:
Mid-range SFRs still move fast—act quickly with a strong offer.
Condo and luxury home shoppers have room to negotiate, especially in SF and Santa Clara counties.
For Sellers:
Price strategically in the red-hot $1.3M–$2.8M range—underpricing still sparks bidding wars.
High-end condo sellers must lead with pricing, staging, and incentives.
For Investors:
Focus on high-performing triple-green tiers for the best ARV returns.
Target Alameda County SFR $1.3M–$1.8M, Contra Costa County SFR $1.8M–$2.3M, and San Mateo County SFR $2.8M–$3.3M - these segments show strong demand, rising prices, and fast closings, making them ideal for flips or short-term holds.
Table of Contents:
SF Bay Area Real Estate Price Trends
KPeterson.realty Proprietary Heat Maps
The charts below are month-over-month and year-over-year heat maps of pricing in the SF Bay Area. They are grouped by county and property type (Condo, Single Family Home, Townhouse). The metrics are Price per Square Foot, Days on Market, how many sold, and the List to Sales Price Ratio. We've now also included average square footage at each price level.
Green highlighted cells indicate items keeping prices up in comparison to previous month's metrics.
Red highlighted cells indicate the opposite, i.e downward pressure on sales price which favor buyers more.
Enlarge each county Heat Map by clicking on each of the images.


SF Bay Area Real Estate Market Matrix - July 2025
County | Property Type | Market Type | Best Price Points for Sellers | Best Price Points for Buyers |
San Mateo | Condos | ⚖️ Neutral | $800K–$1.3M (102% list-to-sale, DOM 29, PPSF rising) | <$800K (PPSF rising, but DOM still long at 47) |
SFR | ✅ Strong Seller | $1.3M–$3.8M (105–109% list-to-sale, DOM 14–24) | <$800K (DOM 87+, slowest-moving) | |
Townhomes | ✅ Seller | $800K–$2M (DOM 19–24, 104–106% list-to-sale) | N/A | |
Santa Clara | Condos | 🛑 Buyer-Leaning | N/A | $1.3M+ (DOM 56–72, price softening) |
SFR | ✅ Strong Seller | $1.3M–$3.8M (105–108% list-to-sale, low DOM) | <$800K (DOM 99, PPSF lower) | |
Townhomes | ✅ Seller | $1.3M–$1.8M (DOM 27–29, 105% list-to-sale) | <$800K (DOM 130+, PPSF down) | |
Alameda | Condos | ⚖️ Neutral | <$800K (DOM 39, 107% list-to-sale) | $800K–$1.3M (DOM 31, flat YoY) |
SFR | ✅ Seller | $1.3M–$2.8M (DOM 23–30, strong over-asking) | $800K–$1.3M (DOM 141+, weak PPSF growth) | |
Townhomes | ⚖️ Neutral | $800K–$1.3M (DOM 21, 102% list-to-sale) | <$800K (DOM 72+, slower velocity) | |
Contra Costa | Condos | ✅ Seller | <$800K–$1.3M (DOM 29–34, 101–103% list-to-sale) | $1.3M+ (DOM rises, fewer sales, weaker pricing) |
SFR | ✅ Strong Seller | <$800K–$1.3M (DOM 27–31, volume surge, 105–108%) | $2.8M+ (DOM 26–41, list-to-sale 96–99%) | |
Townhomes | 🛑 Buyer | N/A | All price points (DOM elevated, low absorption) | |
San Francisco | Condos | 🛑 Buyer | N/A | <$800K & $1.3M–$2M (DOM 48–54, list-to-sale down) |
SFR | ⚖️ Mixed | $2.8M–$4.8M (DOM 15–22, 107–109% list-to-sale) | <$1M (DOM 116+, lowest PPSF) | |
Townhomes | ⚖️ Neutral | <$800K (DOM 26, 103% list-to-sale) | $800K–$1.3M (DOM 30+, price softening) |
20-Year vs. 10-Year Appreciation
Bay Area single-family home prices have historically doubled every 10 years, thanks to a strong local economy and limited supply. Average sale price remained near the all-time high, showing continued strength.
As of this month...
Single family home appreciation over 10 years = 7.3% per year
Condo appreciation over 10 years = 3.5% per year


SF Bay Area Inventory Metrics
Active vs. Sold Listings
Active listings are homes currently on the market, while sold listings reflect homes that have successfully closed. When sold listings outpace active ones, it signals strong demand and favors sellers with faster sales and higher prices; when active listings outnumber sold ones, it suggests more supply and gives buyers more negotiating power and choice.


Single-Family Homes – July 2025
Month-over-Month (MoM):
Active listings continued to climb from June, consistent with seasonal patterns.
Sales volume held steady in the $1.3M–$2.8M range, the most competitive price segment.
Higher-end segments above $3.8M are seeing longer DOM and softer over-asking ratios.
Year-over-Year (YoY):
Active inventory is up YoY in all counties, but sold listings are also slightly higher, keeping the market competitive.
Buyer demand remains strongest in family-friendly school zones and move-up markets.
Compared to Historic Norms:
Inventory remains well below 2008–2012 peaks and still tight compared to pre-pandemic years.
Market conditions still lean seller-friendly, but momentum is cooling at the luxury tier.
Condominiums – July 2025
Month-over-Month (MoM):
Active condo listings rose again in July, outpacing sales across all counties.
Sales activity remains flat to down in all price brackets, with the most weakness in $1.3M+ luxury condos.
Year-over-Year (YoY):
Active condo inventory is up sharply YoY, most notably in San Francisco, Santa Clara, and San Mateo.
Pending and closed sales have declined YoY, especially in urban cores and high-end product.
Compared to Historic Norms:
Inventory levels now mirror early 2020 conditions and are significantly above post-pandemic lows.
This environment favors buyers, particularly cash buyers and those willing to negotiate.
Final Takeaway:
Segment | July 2025 Status | Trend vs June | Long-Term Comparison |
Single-Family Homes | Inventory climbing seasonally, sales steady in $1.3M–$2.8M range; slower in $3.8M+ | ⚠️ Slight cooling at higher price tiers | ✅ Still tight vs post-2008, softening at luxury end |
Condominiums | Listings rising again, sales flat or declining; weakest in $1.3M+ | 📉 Buyer leverage strengthening | ⚠️ Resembles early 2020, oversupply signs in urban/luxury segments |
Months of Supply
The time it would take to sell all active listings at the current sales rate.
20-Year vs. 10-Year Months of Supply
This metric tells us how hot the markets are currently, i.e. the rate of change. If no new listings were added, this metric tells us how long it would take to sell all the remaining active homes. In the last 10 years, we have been in a Seller's Market except for condos in the year of 2020, when the COVID Pandemic hit.
Buyer's Market = Over 6 months of supply
Seller's Market = Under 3 months of supply


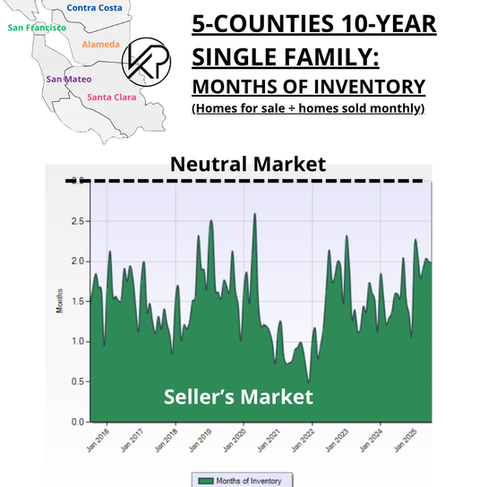


🏡 Single-Family Homes – July 2025
July 2025: ~2.3 months of inventory → still in seller’s market territory but edging toward neutral.
June 2025: ~2.0 months
YoY: Inventory remains well below 2022–2023 peaks but has been on a steady seasonal climb since early spring.
🏢 Condominiums – July 2025
July 2025: ~4.1 months → firmly in neutral territory, nearing a buyer’s market in some counties.
June 2025: ~3.7 months
YoY: Highest since mid-2020 for several counties. Elevated supply continues to put downward pressure on pricing, especially in urban and high-end segments.
Quick summary
Segment | Buyer Advantage? | Seller Advantage? | Advice |
SFR | ❌ Low | ✅ High | Buyers: act fast; focus on move-in-ready homes in top school zones. Sellers: list now. |
Condos | ✅ Moderate | ⚠️ Weakening | Buyers: Negotiate confidently, especially $1.3M+ and urban locations; more inventory = more options. Sellers: Sharpen pricing, boost marketing, and consider incentives to stand out. |
Demand Indicators
% Over Asking vs. DOM (12-Month Look Back)
How much over asking a home sold for and how fast it was sold, i.e. Days On Market are the next two Key Performance Indicators (KPIs) for our SF bay area real estate trends. These show how much demand there is for SF Bay Area single family homes and condos.
Days On Market measures how long it takes for homes to sell.
Buyers: Longer DOM gives more room for negotiation.
Sellers: Shorter DOM indicates strong interest.


🏡 Single-Family Homes – July 2025
Sale-to-list ratio: 103% → down from June’s ~106%, signaling reduced bidding wars.
DOM: 26 days → up from 23 in June, indicating slower absorption.
Market still leans seller-friendly, but momentum is easing.
🏢 Condominiums – July 2025
Sale-to-list ratio: 99.5% → down from ~100.7% in June, showing increased negotiation space.
DOM: 47 days → up from 43, underscoring soft demand and elevated inventory.
Firmly a buyer’s market in many areas, especially for condos $1.8M+. Sellers must price sharply and offer value-adds.
Pending Sales
Homes under contract, i.e. Pending, show how quickly the market is moving.
The graphics below display the pending sales for all five counties, categorized by home types and price levels. The price tiers with the highest volume of pending sales for each home type and county are highlighted in yellow. For example, in San Mateo County, the most condos are sold at prices below $800K, while the most single-family homes and townhouses are sold between $800K and $1.3M. The color coding or heat map indicates changes compared to the previous month, with positive impacts on sales prices highlighted in green and negative impacts highlighted in red.

✅ Green (Seller-Favorable) Patterns - July 2025
(All three metrics: Price/SqFt ↑, DOM ↓, Pending ↑)
San Mateo — SFR $2.8M–$3.3M
Alameda — SFR $1.3M–$1.8M
Contra Costa — SFR $1.8M–$2.3M and SFR $3.8M–$4.3M
Santa Clara — SFR $4.8M–$5.3M
San Francisco — Condo $1.3M–$1.8M and Townhouse < $800K
🟥 Red (Buyer-Leverage) Zones
(All three metrics: Price/SqFt ↓, DOM ↑, Pending ↓)
San Mateo — SFR < $800K, and SFR $1.3M-$1.8M
Alameda — Townhouse $1.3M–$1.8M
Contra Costa — SFR $1.3M-$1.8M, and $2.3M–$2.8M
Santa Clara — SFR $1.3M–$2.3M, and $3.3M–$3.8M
San Francisco — SFR $1.8M-2.3M, and SFR > $5.3M
Macroeconomics
Mortgage Rates
30-year fixed rates fell 36 bps in July to 6.57%.
Still much higher than pre-2022 levels, limiting affordability.
Mortgage applications ticked up only slightly.
If rates hold or drop further, buyer activity could rise in August.


10-Year Treasury
If the 10-year Treasury yield slips later this year, it could pull mortgage rates down too — giving buyers a small but welcome break on borrowing costs.
Yields averaged about 4.39% in July, barely changed from June.
It’s been stuck in a tight range all year (around 4.3%–4.4%), showing that markets expect the Fed to keep interest rates steady for now.
Big factors keeping yields up: stubborn inflation, rising government debt, and lots of new bonds being issued.
Looking ahead, if the Fed cuts rates later this year as expected, yields could dip — which might help keep mortgage rates from climbing.
Stock Market
NASDAQ (Tech-Heavy Index)
July 2025: +3.7% — multiple record highs (14 in one month).
June 2025: +2.4% — gains led by AI, semiconductor, and cloud stocks.
YoY (July 2024 → July 2025): +28% — tech has been the primary driver of market strength over the past year, fueled by AI adoption and strong earnings.
S&P 500
July 2025: +2.9% — five straight record closes mid-month.
June 2025: +1.8% — also hit records, but slower pace than July.
YoY: +20% — broad market gains, with tech and healthcare leading.
Dow Jones Industrial Average
July 2025: +0.9% — lagged behind NASDAQ & S&P; energy and industrials dragged performance.
June 2025: +0.6% — same pattern of underperformance.
YoY: +9% — still positive but far behind the tech-heavy NASDAQ due to sector mix.
Bay Area Tech Impact:Local giants like Microsoft (first $4T valuation), Meta, and Nvidia all beat earnings expectations in July. This is boosting stock-option wealth and could translate to stronger high-end homebuyer activity in Q3/Q4 — especially among tech employees cashing in on gains.
FED (Federal Reserve)
The Fed held its key rate steady at 4.25%–4.50% in July, continuing the pause for the fifth meeting in a row.
Two governors—Michelle Bowman and Christopher Waller—voted for a cut instead of holding.
Markets now expect a cut in September, with some pricing in multiple cuts before year-end.
What this means for borrowers: Mortgage rates likely remain high through summer, but there’s growing hope for relief if conditions soften.
What to Keep an Eye On
Jobs data — Weakening hiring or rising unemployment could spur earlier rate cuts. Reuters
Inflation trends — If core inflation (like services) cools, the Fed will see more easing room.
Tariff and trade pressure — More inflation risks here could delay rate cuts.
Inflation
Headline CPI for June (released Mid-July) rose 2.7% year-over-year, up from 2.4% in May—showing inflation ticked higher again.
Core CPI (excluding food and energy) increased 2.9% YoY, slightly above last month’s 2.8%, underlining persistent underlying price pressures.
Shelter costs continue to be a major drag, rising by 3.8% over the past year—the biggest contributor to headline inflation.
Monthly CPI rose 0.3%, led by higher energy and food prices, with core prices up 0.2%
What to Watch For
Inflation remains above the Fed’s 2% goal, so borrowing costs and mortgage rates likely stay elevated for now.
Continued cooling in shelter (rent/housing) could help bring inflation—and eventually rates—down.
Watch for tariff-related price bumps, which may fuel temporary inflation blips ahead.
Employment
The U.S. added 170,000 jobs in July, slightly above forecasts, with gains led by healthcare, construction, and leisure/hospitality. (bls.gov)
Unemployment held at 4.2%, its highest level in over two years, indicating a cooling labor market but no recession signal yet.
Wage growth slowed further to 3.8% YoY, easing inflation pressure but still supporting consumer spending.
In the SF Bay Area, layoffs continued in tech but at a slower pace — Meta cut ~300 roles in Menlo Park, while Google added 150 AI-focused positions in Mountain View.
Healthcare, clean tech, and biotech hiring remained strong in Santa Clara and San Mateo counties, offsetting some tech losses.
What to Watch For
Tech earnings & hiring plans — surprises here could quickly shift local buyer confidence.
Weekly unemployment claims — a sustained rise would point to broader weakness.
Sector-specific Bay Area growth — AI, clean energy, and health innovation remain the strongest local job drivers.
Working in the SF Bay Area
Remote Work & RTO Mandates
Google is enforcing mandatory in-office attendance for employees within 50 miles—at least 3 days/week—or face potential termination.
Microsoft is considering tightening policy to require 3 in-office days/week starting January 2026. Final decision expected by September.
Uber raised its in-office requirement from 2 to 3 days/week and is expanding SF and Seattle office space by 700,000 sq ft through 2026 to support the shift.
Dropbox remains a standout “virtual-first” employer—employees typically work remotely about 90% of the time, citing work-life balance and efficiency.
Across the Bay Area, hybrid schedules are on the rise: as of early 2025, the average employee works ~3 days/week in-office, with expectations that 27% will be fully in-office and 62% hybrid by August.
Regional Transit Trends
Office attendance is transitioning: while weekday ridership on BART has grown slightly, overall usage remains below pre-pandemic levels due to continued remote and hybrid work.
With lower ridership, transit agencies are introducing new fare programs (e.g., BayPass) and service improvements to attract riders.
Office Space & leasing dynamics
San Francisco office vacancy fell from 35.8% to 35.1% in Q2—the sharpest decline since 2015—driven mainly by demand from AI firms. San Francisco Chronicle
According to CBRE, vacancy dropped slightly to 34.8%, with positive net absorption (~780,000 sq ft) and average asking rents around $68.73/sq ft. AI companies accounted for 40% of new leasing activity in SF.
Moloco, a fast-growing ad-tech startup, is subleasing 60,000 sq ft in Menlo Park—doubling its current space and signaling renewed demand for Bay Area offices. SFgate
OpenAI is negotiating a 210,000 sq ft lease in Mission Bay, expanding its footprint during a time of office-market recovery. San Francisco Chronicle
Startups and Venture Capital
Bay Area AI startups are drawing massive funding—in the first half of 2025, VC investments in AI ventures reached $74.6 billion, more than triple the amount from the same period last year. Washington Post
San Francisco remains a capital magnet: Startups there pulled in over $41.6 billion in spring alone, led by OpenAI’s staggering $40 billion raise—the largest in startup history. Nucamp
Big funding, big moves: Harvey AI just locked in a $300 million Series E (valuing the company at $5 billion) and signed a lease for a 92,000 sq ft office, sparking a surge in downtown office uptake. San Francisco Chronicle
Emerging sectors gaining attention: Public-safety tech (like AI-powered tools for emergency response) saw nearly $1 billion in VC funding this year, nearly double last year’s total. WSJ
Startup costs are dropping—thanks to AI tools, some startups are reaching Series A with up to 80% less seed capital, allowing faster, more efficient scaling. Axios
Why It Matters for Real Estate
Office leasing and hiring are back—heavily fueled by AI and VC activity, particularly in Mission Bay, SoMa, and the Peninsula.
High-value workers flock to live near work—this fuels demand for premium housing in innovation corridors.
Neighborhood stratification increases—entry-level housing remains soft, while central nodes with strong startup momentum see surging demand and rents.
To subscribe:


Comments