
Mid-Peninsula Real Estate Market Report — May 2026 | San Mateo County
- Kevin Peterson
- Jun 2
- 9 min read

Mid-Peninsula Real Estate Market Report — May 2026
Published by Kevin Peterson, KPeterson Realty | DRE #02128545 | May 2026
What This Report Covers
This report analyzes 14,738 confirmed Bay Area closed sales (January–May 2026) and 3,839 May 2025 comparison records — broken out by city, price tier, SFR vs. Condo/Townhouse, and five-county region. Every data point is sourced from Bay East / BAREIS MLS confirmed closed sales.
Three Numbers That Define May 2026
109.7% — San Francisco SFR Sale-to-List Ratio (up from 103.2% in May 2025)
105.1% — San Mateo County SFR Sale-to-List Ratio (flat vs. April 2026)
6.51% — 30-Year Fixed Mortgage Rate (Freddie Mac, May 21, 2026)
The Market Hasn't Softened — It's Getting More Selective
Homes priced correctly and prepared to show-ready standards are still generating multiple offers above ask. Overpriced or underprepared homes are sitting in a market with rising inventory. May's volume pullback is seasonal. The widening gap between those two outcomes is not.
— Kevin Peterson, May 2026
Strategic Guidance — Timing the Market
For those positioned within these specific market segments, the current data signals a definitive window for action that warrants immediate attention.
$1.5M–$2.5M Sellers — Mid-Peninsula
The data indicates this is the most favorable listing window of 2026.
San Carlos and San Mateo closed at 110–111% of list in May with under 12 days on market. Historically, inventory rises 18–25% from June through August. Each week of delay measurably reduces competitive leverage as supply increases and buyer attention fragments across more options.
$1.5M–$2.5M Buyers — Mid-Peninsula
A defined 60–90 day window exists before macroeconomic conditions shift materially.
Purchase applications are running 7% above year-ago levels — buyers are adapting to 6.5% rates rather than waiting. If Q3 inflation data triggers a Fed response, the same home carries $400–$600 more in monthly carrying cost. The window is present; it is not permanent.
Hillsborough · Atherton · Palo Alto · Menlo Park Sellers
Liquidity events in the AI sector are creating a buyer pool that does not respond to conventional market cycles.
Hillsborough averaged 4–7 days on market at 106.6% of list in May. Menlo Park's $4M–$6M tier closed at 107.2%. Pending IPO events at Databricks, Anthropic, and affiliated companies will unlock equity at scale — Sand Hill Road proximity is a quantifiable demand driver that strengthens as each liquidity event clears.
Under $1.5M — Buyers
Current conditions represent the most negotiable entry point this segment has offered in three years.
Sub-$1.5M homes in San Mateo are averaging 20 days on market at 99.0% of list — below ask. Workforce reductions at Meta, GoPro, and LinkedIn are introducing motivated sellers into this tier. This dynamic is tied to job market conditions and will normalize as the labor market stabilizes, most likely by Q4.
Section 1 — City-Level Data: Single Family Homes
All cities from San Mateo to Palo Alto, broken into price tiers with actual May 2026 closings. Tiers with no activity are not shown. Redwood City includes Redwood Shores and Emerald Hills (zip 94062). Palo Alto reflects Santa Clara County records.
MoM Δ Price = median price change vs. April 2026. YoY Δ Price = median price change vs. May 2025.
San Mateo — SFR
Price Tier | Units | Med Price | DOM | Sale/List | MoM Δ Price | YoY Δ Price |
$800K–$1.5M | 5 | $1.41M | 29d | 100.0% | +$104k (+8%) | +$324k (+30%) |
$1.5M–$2.5M | 26 | $2.03M | 11d | 110.9% | +$100k (+5%) | +$27k (+1%) |
$2.5M–$4M | 16 | $3.03M | 10d | 113.3% | +$244k (+9%) | +$147k (+5%) |
Burlingame — SFR
Price Tier | Units | Med Price | DOM | Sale/List | MoM Δ Price | YoY Δ Price |
$800K–$1.5M | 1 | $1.20M | 33d | 72.7% | −$291k (−20%) | — |
$1.5M–$2.5M | 1 | $2.19M | 8d | 100.0% | +$241k (+12%) | +$105k (+5%) |
$2.5M–$4M | 7 | $3.18M | 9d | 109.7% | +$90k (+3%) | +$125k (+4%) |
$4M–$6M | 4 | $4.26M | 6d | 104.2% | −$192k (−4%) | −$132k (−3%) |
$6M–$8M | 2 | $6.24M | 10d | 101.0% | +$232k (+4%) | — |
Hillsborough — SFR
Price Tier | Units | Med Price | DOM | Sale/List | MoM Δ Price | YoY Δ Price |
$4M–$6M | 5 | $5.73M | 13d | 101.2% | +$1.18M (+26%) | +$600k (+12%) |
$6M–$8M | 4 | $7.30M | 4d | 106.6% | +$921k (+14%) | +$276k (+4%) |
$8M–$10M | 2 | $8.50M | 12d | 106.3% | −$62k (−1%) | — |
Belmont — SFR
Price Tier | Units | Med Price | DOM | Sale/List | MoM Δ Price | YoY Δ Price |
$800K–$1.5M | 2 | $1.37M | 12d | 126.9% | — | — |
$1.5M–$2.5M | 4 | $1.85M | 18d | 98.4% | −$375k (−17%) | −$302k (−14%) |
$2.5M–$4M | 7 | $3.20M | 15d | 100.8% | +$308k (+11%) | +$322k (+11%) |
San Carlos — SFR
Price Tier | Units | Med Price | DOM | Sale/List | MoM Δ Price | YoY Δ Price |
$1.5M–$2.5M | 8 | $2.03M | 10d | 106.3% | −$130k (−6%) | −$200k (−9%) |
$2.5M–$4M | 11 | $3.35M | 8d | 103.4% | +$375k (+13%) | +$425k (+15%) |
$4M–$6M | 3 | $4.15M | 8d | 109.3% | +$75k (+2%) | −$62k (−1%) |
$6M–$8M | 1 | $6.00M | 12d | 113.3% | — | — |
Foster City — SFR
Price Tier | Units | Med Price | DOM | Sale/List | MoM Δ Price | YoY Δ Price |
$1.5M–$2.5M | 5 | $2.19M | 8d | 100.0% | −$112k (−5%) | −$12k (−1%) |
$2.5M–$4M | 2 | $2.78M | 5d | 116.0% | +$125k (+5%) | −$175k (−6%) |
Redwood City Area — SFR (incl. Redwood Shores & Emerald Hills)
Price Tier | Units | Med Price | DOM | Sale/List | MoM Δ Price | YoY Δ Price |
$800K–$1.5M | 3 | $1.30M | 20d | 102.4% | +$40k (+3%) | +$128k (+11%) |
$1.5M–$2.5M | 10 | $2.11M | 14d | 104.0% | +$250k (+13%) | +$210k (+11%) |
$2.5M–$4M | 11 | $2.91M | 7d | 110.2% | +$95k (+3%) | −$188k (−6%) |
$4M–$6M | 6 | $4.53M | 6d | 102.7% | −$148k (−3%) | −$374k (−8%) |
Menlo Park — SFR
Price Tier | Units | Med Price | DOM | Sale/List | MoM Δ Price | YoY Δ Price |
$1.5M–$2.5M | 2 | $1.88M | 10d | 118.4% | −$212k (−10%) | −$36k (−2%) |
$2.5M–$4M | 6 | $3.36M | 18d | 103.6% | −$100k (−3%) | +$93k (+3%) |
$4M–$6M | 7 | $4.50M | 10d | 107.2% | −$800k (−15%) | −$860k (−16%) |
$6M–$8M | 2 | $6.67M | 30d | 102.2% | −$6k (−0%) | −$102k (−2%) |
$10M–$20M | 1 | $13.5M | 6d | 100.0% | +$1.75M (+15%) | — |
Atherton — SFR
Price Tier | Units | Med Price | DOM | Sale/List | MoM Δ Price | YoY Δ Price |
$2.5M–$4M | 2 | $3.68M | 11d | 101.2% | −$124k (−3%) | — |
$4M–$6M | 1 | $5.45M | 50d | 99.2% | +$1.45M (+36%) | — |
$8M–$10M | 1 | $9.25M | 6d | 92.5% | +$200k (+2%) | +$570k (+7%) |
$10M–$20M | 2 | $14.25M | 56d | 103.5% | +$1.12M (+9%) | +$2.05M (+17%) |
Over $20M | 2 | $27.88M | 40d | 99.9% | +$5.13M (+23%) | — |
Palo Alto — SFR (Santa Clara County)
Price Tier | Units | Med Price | DOM | Sale/List | MoM Δ Price | YoY Δ Price |
$1.5M–$2.5M | 1 | $2.42M | 8d | 110.1% | +$501k (+26%) | — |
$2.5M–$4M | 15 | $3.26M | 14d | 106.7% | +$48k (+2%) | −$140k (−4%) |
$4M–$6M | 12 | $4.90M | 8d | 111.1% | +$383k (+8%) | +$340k (+7%) |
$6M–$8M | 7 | $6.81M | 7d | 108.4% | −$465k (−6%) | +$24k (+0%) |
$8M–$10M | 2 | $8.06M | 6d | 115.2% | −$1.08M (−12%) | −$978k (−11%) |
$10M–$20M | 2 | $12.75M | 22d | 96.5% | −$4.37M (−26%) | — |
Over $20M | 1 | $22.00M | 97d | 88.4% | — | — |
Section 1 continued — Condo / Townhouse Data
Hillsborough and Atherton excluded — no C/TH market in either city.
San Mateo — C/TH
Price Tier | Units | Med Price | DOM | Sale/List | MoM Δ Price | YoY Δ Price |
Under $800K | 6 | $637k | 17d | 99.1% | +$57k (+10%) | −$1k (−0%) |
$800K–$1.5M | 11 | $1,130k | 17d | 98.9% | −$107k (−9%) | +$5k (+0%) |
$1.5M–$2.5M | 4 | $1,750k | 12d | 105.3% | +$160k (+10%) | −$350k (−17%) |
San Carlos — C/TH
Price Tier | Units | Med Price | DOM | Sale/List | MoM Δ Price | YoY Δ Price |
Under $800K | 1 | $750k | 80d | 96.8% | −$15k (−2%) | +$91k (+14%) |
$800K–$1.5M | 3 | $968k | 11d | 100.0% | −$287k (−23%) | +$40k (+4%) |
$1.5M–$2.5M | 5 | $1,880k | 10d | 110.7% | +$150k (+9%) | +$151k (+9%) |
Foster City — C/TH
Price Tier | Units | Med Price | DOM | Sale/List | MoM Δ Price | YoY Δ Price |
Under $800K | 2 | $505k | 10d | 99.1% | −$215k (−30%) | — |
$800K–$1.5M | 8 | $1,305k | 13d | 101.8% | +$105k (+9%) | +$45k (+4%) |
$1.5M–$2.5M | 4 | $1,613k | 28d | 100.0% | +$25k (+2%) | +$13k (+1%) |
Redwood City Area — C/TH
Price Tier | Units | Med Price | DOM | Sale/List | MoM Δ Price | YoY Δ Price |
Under $800K | 1 | $678k | 10d | 96.1% | −$24k (−3%) | +$14k (+2%) |
$800K–$1.5M | 2 | $1,236k | 24d | 99.2% | −$89k (−7%) | −$102k (−8%) |
$1.5M–$2.5M | 3 | $1,658k | 34d | 100.0% | +$96k (+6%) | +$98k (+6%) |
Menlo Park — C/TH
Price Tier | Units | Med Price | DOM | Sale/List | MoM Δ Price | YoY Δ Price |
$800K–$1.5M | 2 | $1,038k | 91d | 96.0% | +$128k (+14%) | −$238k (−19%) |
$1.5M–$2.5M | 2 | $2,205k | 14d | 100.6% | +$138k (+7%) | +$158k (+8%) |
⚠️ Menlo Park $800K–$1.5M C/TH: 91 days on market at 96.0% of list — investigate HOA reserve and insurance status before offering in this range.
Palo Alto — C/TH
Price Tier | Units | Med Price | DOM | Sale/List | MoM Δ Price | YoY Δ Price |
Under $800K | 1 | $765k | 37d | 97.5% | +$84k (+12%) | — |
$800K–$1.5M | 6 | $1,089k | 18d | 100.0% | −$41k (−4%) | −$111k (−9%) |
$1.5M–$2.5M | 5 | $1,800k | 38d | 98.0% | — | −$350k (−16%) |
City Narratives
San Mateo: 68 total closings — county's highest volume. SFR $1.5M–$2.5M: 26 closings at 110.9% sale-to-list, 11 days. C/TH under $1.5M softer at 98.9% — rate pressure is most visible at the entry tier.
Burlingame: 15 closings. SFR $2.5M–$4M (7 closings, 9 days, 109.7%) and $4M–$6M (4 closings, 6 days) reflect structural demand driven by school premiums and walk-to-downtown proximity.
Hillsborough: SFR-only market — no condos or townhouses. 11 closings, all Over $4M. The $6M–$8M tier at 4 days and 106.6% sale-to-list is AI/VC wealth buying, not rate-sensitive demand.
Belmont & San Carlos: San Carlos is the strongest mid-market signal — C/TH $1.5M–$2.5M at 110.7% sale-to-list, 10 days. Belmont's SFR $2.5M–$4M at 100.8% is the soft spot — slight negotiating room for buyers there.
Foster City: C/TH market dominates: 14 closings across three tiers. SFR $1.5M–$2.5M moved at 8 days — unusually fast. Foster City is underpriced relative to Burlingame for comparable product.
Redwood City Area: 36 combined closings. SFR $2.5M–$4M: 110.2% sale-to-list at 7 days — the most overlooked value tier on the Peninsula, comparable to Menlo Park at $500K–$1M less.
Menlo Park: 22 SFR closings across 5 tiers. The $4M–$6M SFR tier at 107.2% reflects Sand Hill Road proximity premium. C/TH warning: 2 closings at 91 days, 96.0% of list — almost certainly units with HOA or insurance issues. Verify before offering.
Atherton: SFR-only. 8 closings, all Over $2.5M. Two Over $20M closings at a $27.9M median (40 days). Even at this level, the $4M–$6M listing sat 50 days at 99.2% — overpricing is penalized at every price point.
Palo Alto: 52 SFR closings across 7 tiers — most of any city. The $8M–$10M SFR tier at 115.2% sale-to-list and 6 days is the hottest sub-tier in the five-county Bay Area. C/TH softening in the $1.5M–$2.5M range (38 days, 98.0%) reflects rate sensitivity even in this premium zip.
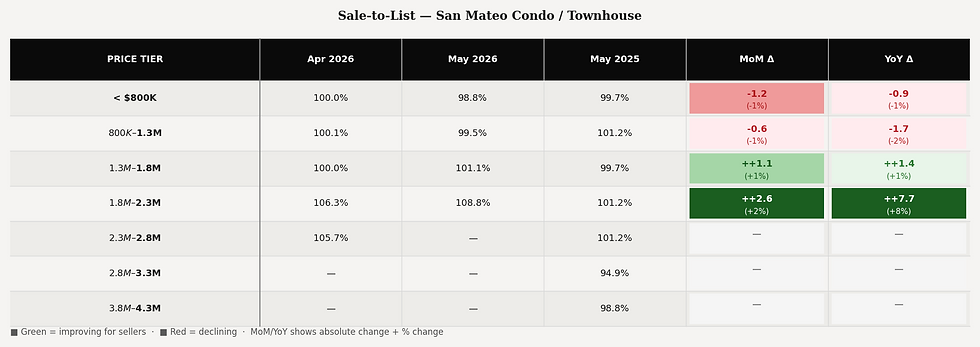
Section 2 — San Mateo County: Where Competition Is Concentrated
The heatmaps embedded above show Apr 2026, May 2026, and May 2025 data with color-coded delta columns. Green = improving for sellers. Red = declining.
Key SFR findings:
The $1.3M–$2.8M range shows the strongest improvement year-over-year
Above $3.3M, more variability — sellers need a differentiated approach, not just a price
The sub-$800K SFR tier posted a −14.7 percentage point sale-to-list decline MoM — the sharpest drop in the county

Key C/TH findings:
Under-$800K volume fell 78% MoM — rate pressure on first-time buyers is acute
The $1.8M–$2.3M C/TH tier held flat — insulated by limited supply
San Carlos C/TH $1.5M–$2.5M at 110.7% sale-to-list is the strongest C/TH reading on the Peninsula
Section 3 — Five-County Bay Area Comparison
County | May 2026 | Apr 2026 | May 2025 | MoM Δ | YoY Δ | SFR Med | C/TH Med | DOM | SFR S/L | C/TH S/L |
San Mateo | 353 | 545 | 485 | −192 (−35%) | −132 (−27%) | $1.89M | $1.14M | 11d | 105.1% | 100.0% |
Santa Clara | 682 | 980 | 741 | −298 (−30%) | −59 (−8%) | $2.00M | $965k | 11d | 102.0% | 100.0% |
Alameda | 526 | 689 | 559 | −163 (−24%) | −33 (−6%) | $1.39M | $674k | 13d | 103.9% | 100.0% |
Contra Costa | 528 | 688 | 608 | −160 (−23%) | −80 (−13%) | $940k | $600k | 13d | 100.2% | 100.0% |
San Francisco | 186 | 250 | 174 | −64 (−26%) | +12 (+7%) | $2.18M | $1.31M | 12d | 124.0% | 101.2% |

What Others Are Missing
SF's ratio is AI-wealth, not broad market heat. At 6.5% rates markets soften. SF's 109.7% SFR ratio doesn't. Q1 2026 Bay Area AI companies raised $180B+ in VC. Anthropic, OpenAI, xAI, and Waymo founders are cash buyers. Rate sensitivity is irrelevant to someone with a $50M equity position.
The Over $4M tier is moving faster than the middle — a rate-cycle first. Hillsborough at 7 days and Palo Alto's $8M–$10M SFR at 115.2% sale-to-list is a market reversal. The AI boom is creating nine-figure net worth individuals faster than at any point in history.
The $800K–$1.5M C/TH tier is where AI is hurting, not helping. Meta cut 200 Bay Area employees in May. GoPro eliminated 23% of its San Mateo workforce. These workers are the buyer profile for sub-$1.5M C/TH units. DOM is lengthening fastest here. Buyers with strong finances have real leverage.
Redwood City is the overlooked value play. Redwood City's $2.5M–$4M SFR tier: 110.2% sale-to-list, 7 days — comparable to Menlo Park at $500K–$1M less. Realtor.com (May 28, 2026) confirmed AI-sector buyers put $198K more cash down per transaction than pre-2023 norms.
Section 4 — The Forces Behind the Numbers
Bay Area Tech & AI Wealth
Q1 2026 set a global VC record: $300B deployed, 80% to AI companies, 60% captured by the Bay Area. Anthropic ($30B), OpenAI ($122B), xAI ($20B), and Waymo ($16B) are all Bay Area-headquartered. A Realtor.com report confirmed Bay Area luxury buyers put down a median 35% in 2025 — $198K above pre-2023 norms — driven directly by AI workers liquidating equity into real estate.

IPO Watch — Real Estate Impact: Each of the following creates a new cohort of $2M–$10M homebuyers within 90 days of lock-up expiration:
Databricks — SF · ~$134B valuation · IPO-ready 2026
Anthropic — SF · ~$350B · Largest potential Bay Area liquidity event in history
Cerebras Systems — Sunnyvale · Targeting public markets
Macroeconomic Environment
The 30-year fixed rate ended May at 6.51% (Freddie Mac, May 21), tracking the 10-year Treasury at 4.56%. The normal spread is 1.5–1.7 percentage points; at 1.95% today, rates could compress even without Fed action.

What the spread divergence means:
January's 2.36pp spread was far above the historical norm, adding roughly $500/month to a $1.5M loan. April's compression to 1.66pp was the best buyer window of 2026 — and why well-prepared sellers saw the strongest competition that month. May's re-widening to 1.95pp reflects renewed inflation concerns. If the spread normalizes, mortgage rates could fall 0.25–0.35pp without any Fed cut.
pp = percentage points (1pp = 100 basis points)
Ready to Talk About What This Means for You?
For those positioned within these market segments, a conversation about timing is worth having now.
Kevin Peterson · DRE #02128545 · kevin@kpeterson.realty
Kiri Peterson · DRE #02027263 · kiri@kpeterson.realty
For informational purposes only. Not financial, legal, or tax advice. Market data: Bay East / BAREIS MLS confirmed closed sales. Macro data: Freddie Mac PMMS, MBA, U.S. BLS, U.S. Treasury, Realtor.com (May 28, 2026). Stock performance approximate. IPO valuations are private estimates subject to change. Past performance is not indicative of future results.


Comments